. 2014 Sep;96(3):397-410.
doi: 10.1189/jlb.1A0913-500RR. Epub 2014 May 13.

Inflammation programs self-reactive CD8+ T cells to acquire T-box-mediated effector function but does not prevent deletional tolerance

Affiliations

Inflammation programs self-reactive CD8+ T cells to acquire T-box-mediated effector function but does not prevent deletional tolerance

Stephanie R Jackson et al. J Leukoc Biol. 2014 Sep.

Abstract

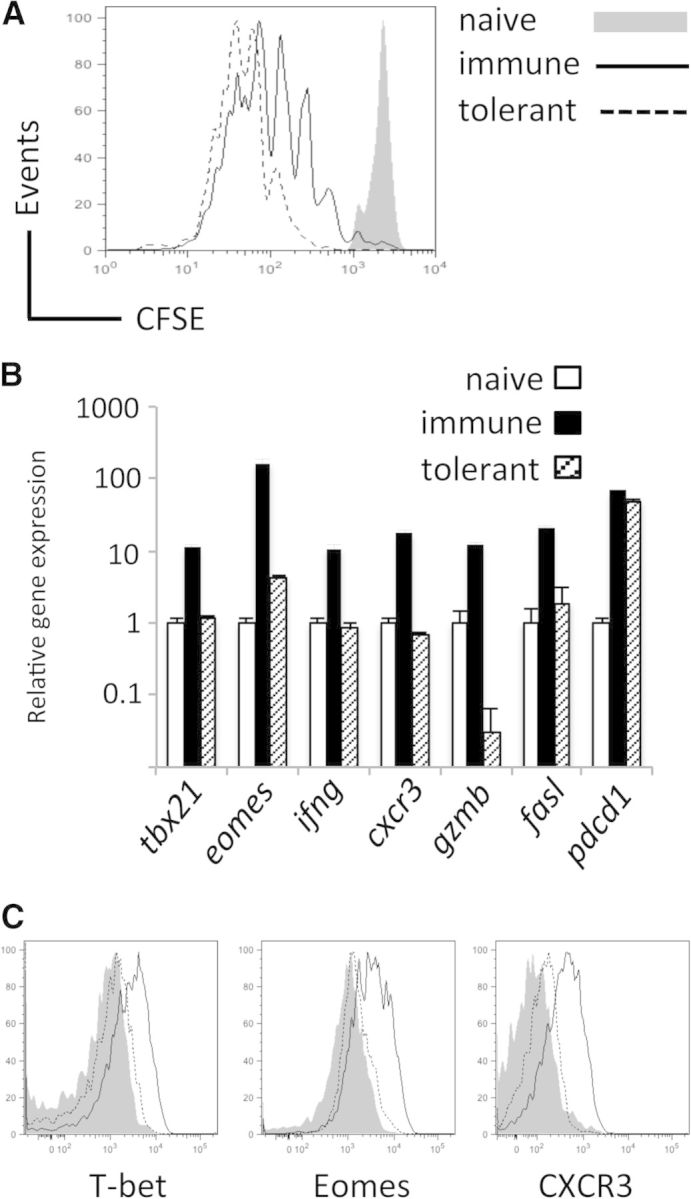
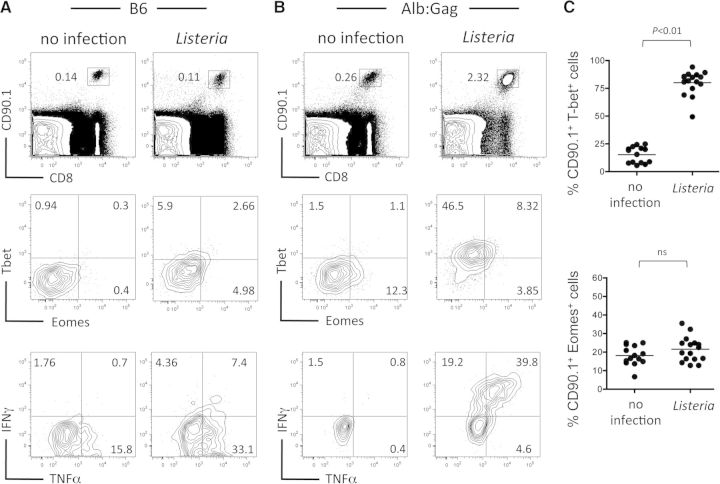
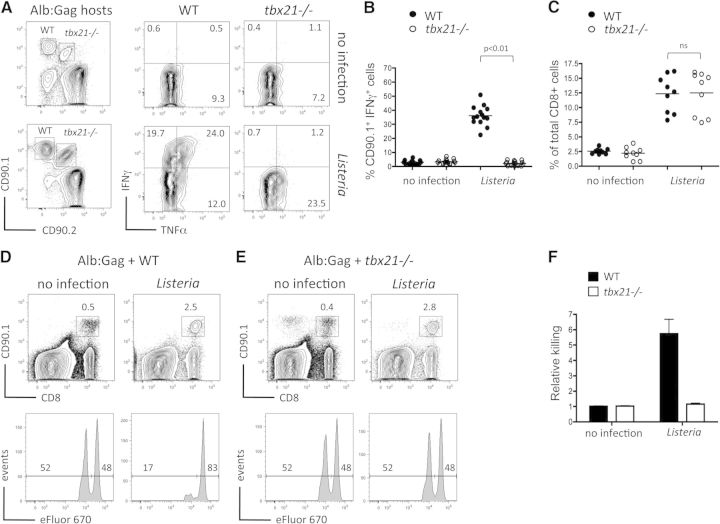
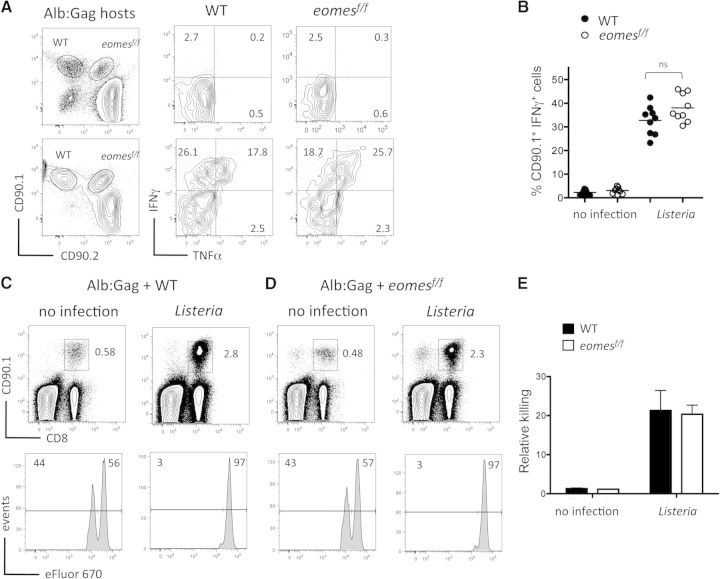
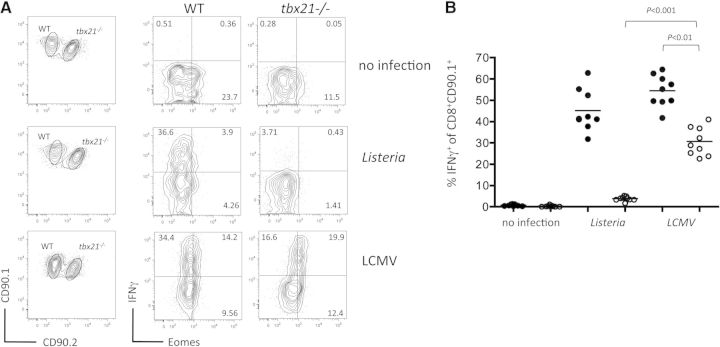
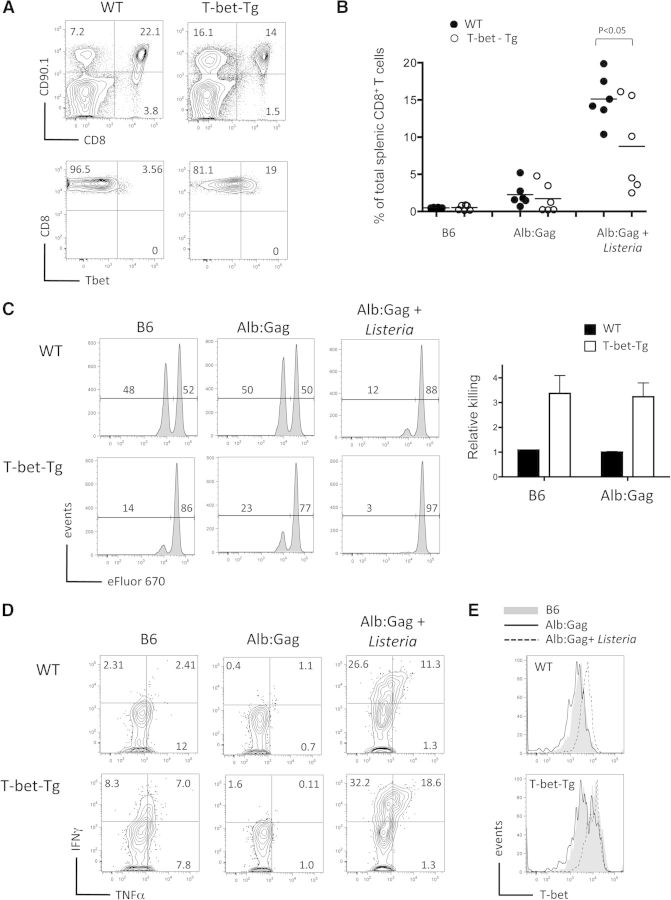
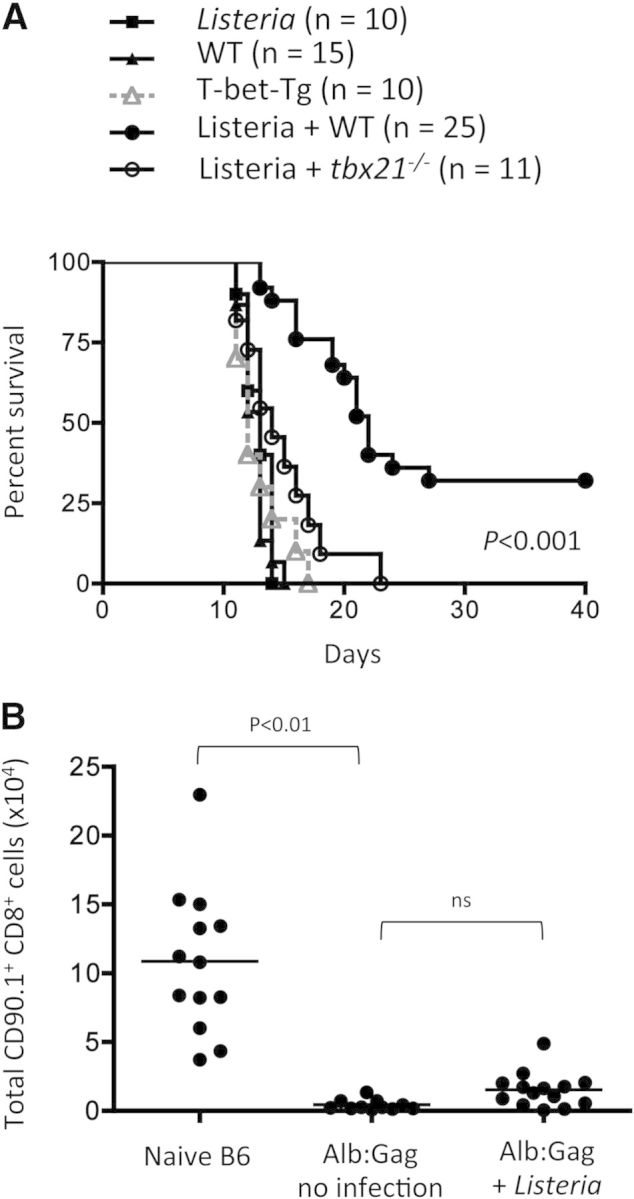
CD8(+) T cells must detect foreign antigens and differentiate into effector cells to eliminate infections. But, when self-antigen is recognized instead, mechanisms of peripheral tolerance prevent acquisition of effector function to avoid autoimmunity. These distinct responses are influenced by inflammatory and regulatory clues from the tissue environment, but the mechanism(s) by which naive T cells interpret these signals to generate the appropriate immune response are unclear. The identification of the molecules operative in these cell-fate decisions is crucial for developing new treatment options for patients with cancer or autoimmunity, where manipulation of T cell activity is desired to alter the course of disease. With the use of an in vivo murine model to examine CD8(+) T cell responses to healthy self-tissue, we correlated self-tolerance with a failure to induce the T-box transcription factors T-bet and Eomes. However, inflammation associated with acute microbial infection induced T-bet and Eomes expression and promoted effector differentiation of self-reactive T cells under conditions that normally favor tolerance. In the context of a Listeria infection, these functional responses relied on elevated T-bet expression, independent of Eomes. Alternatively, infection with LCMV induced higher Eomes expression, which was sufficient in the absence of T-bet to promote effector cytokine production. Our results place T-box transcription factors at a molecular crossroads between CD8(+) T cell anergy and effector function upon recognition of peripheral self-antigen, and suggest that inflammation during T cell priming directs these distinct cellular responses.

Keywords: effector differentiation/immunity; immunotherapy; transcription factors.


Figures

Figure 1.
Figure 1.. CD8+ T cells proliferate but fail to express T-bet or Eomes upon self-antigen encounter.
CD8+ CD90.1+ Gag-specific T cells were adoptively transferred into naive (B6), immunizing (B6+FBL), or tolerizing (Alb:Gag) environments. (A) CFSE dilution by transferred T cells was assessed 3 days later and is displayed in overlayed histograms. (B) Real-time PCR analysis of tbx21, eomes, ifng, cxcr3, gzmb, fasl, and pdcd1 mRNA expression in FACS-purified T cells, 3 days after transfer into a naive, immunizing, or tolerizing environment. Data are presented as relative expression versus β-actin control, and error bars are sd. (C) T-bet, Eomes, and CXCR3 protein expression in T cells, 3 days after adoptive transfer, is compared directly by overlaid histograms from naive, immunizing, or tolerizing environments. Data are representative of three experiments, each with three recipients/group.
Figure 2.
Figure 2.. Induction of T cell effector function corresponds with T-bet expression.
CD8+ CD90.1+ Gag-specific T cells were transferred into (A) B6 or (B) tolerizing Alb:Gag recipients, with or without infection with Listeria. Recipient spleens were analyzed 3 days later for the frequency of transferred T cells by flow cytometry (top). Inset numbers are the percent of total splenocytes within the inscribed square region. Intracellular T-bet and Eomes protein expression was assessed directly ex vivo (middle), and IFN-γ and TNF-α production were determined after overnight restimulation with Gag peptide (bottom). Numbers in each quadrant represent the percent of gated CD8+ CD90.1+ T cells, and data are representative of six separate experiments, each with two to three mice/group. (C) The percent of gated CD8+ CD90.1+ T cells that express T-bet (top) or Eomes (bottom) in differentially treated Alb:Gag recipients is depicted, with each circle representing individual mice pooled from six separate experiments. Horizontal bars represent the average for each group, and P values are indicated.
Figure 3.
Figure 3.. T-bet is required for effector function within a tolerizing environment.
(A) TCR-Tg, Gag-specific T cells on a WT background (CD90.1+) or tbx21−/− background (CD90.1+/CD90.2+) were cotransferred into tolerizing Alb:Gag recipients, with or without Listeria infection. Three days later, production of IFN-γ and TNF-α by transferred T cells was measured after overnight restimulation with the Gag peptide (right). Numbers in each quadrant represent the percent of gated CD8+ CD90.1+ or CD90.1+/CD90.2+ T cells. (B) The percent of gated CD8+ CD90.1+ T cells that express IFN-γ in differentially vaccinated Alb:Gag recipients from A is depicted, with each circle representing individual mice (n=14) pooled from five separate experiments. (C) Frequency of tbx21−/− or WT of total CD8+ T cells is depicted, 3 days after transfer, with each circle representing individual mice (n=8) pooled from three separate experiments. CD90.1+ Gag-specific CD8+ T cells from (D) WT or (E) tbx21−/− donor mice were transferred separately into tolerizing Alb:Gag recipients (CD90.2+), with or without infection with Listeria. Three days after T cell transfer, recipients were infused with a 1:1 ratio of Gag (eFluor 670low) and control (eFluor 670high) peptide-pulsed target cells. Twenty hours later (Day 4), recipient spleens were harvested, and the frequency of transferred Gag-specific T cells was determined by flow cytometry (upper). Inset numbers are the percent of total splenocytes within the inscribed regions. Target cell frequency is displayed as histograms with the percentage of total eFluor 670-positive cells inset above the indicated regions (lower). (F) Graph displays relative target cell killing (percent eFluor 670high/percent eFluor 670low) pooled from four independent experiments, each with three mice/group (n=12), and error bars represent sd. See also Supplemental Fig. 1.
Figure 4.
Figure 4.. Eomes is dispensable for Listeria-mediated CD8+ T cell effector differentiation within the tolerizing environment.
(A) TCR-Tg, Gag-specific T cells on a WT background (CD90.1+) or Eomes-deficient (eomesf/f) background (CD90.1+/CD90.2+) were cotransferred into tolerizing Alb:Gag recipients, with or without Listeria infection. Three days later, production of IFN-γ and TNF-α by transferred T cells was measured after overnight restimulation with the Gag peptide (right). Numbers in each quadrant represent the percent of gated CD8+ CD90.1+ or CD90.1+/CD90.2+ T cells. (B) The percent of gated CD8+ CD90.1+ T cells that express IFN-γ in differentially vaccinated Alb:Gag recipients from A is depicted, with each circle representing individual mice (n=9) pooled from three separate experiments. (C) WT or (D) Eomes-deficient CD90.1+ Gag-specific CD8+ T cells were transferred into tolerizing Alb:Gag recipients (CD90.2+), with or without Listeria infection. Three days after T cell transfer, recipients were infused with a 1:1 ratio of Gag (eFluor 670low) and control (eFluor 670high) peptide-pulsed target cells. Twenty hours later (Day 4), recipient spleens were harvested, and the frequency of transferred Gag-specific T cells was determined by flow cytometry (upper). Inset numbers are the percent of total splenocytes within the inscribed regions. Target cell frequency is displayed as histograms with the percentage of total eFluor 670-positive cells inset above the indicated regions (lower). (E) Graph displays relative target cell killing (percent eFluor 670high/percent eFluor 670low) pooled from three independent experiments, and error bars represent sd.
Figure 5.
Figure 5.. Eomes expression augments IFN-γ responses by T-bet-deficient T cells within the tolerizing environment.
WT (CD90.1+) or tbx21−/− (CD90.1+/CD90.2+) Gag-specific T cells were cotransferred into tolerizing Alb:Gag recipients, with or without infection with Listeria or LCMV. (A) After 3 days, intracellular IFN-γ and Eomes protein expression in transferred T cells was assessed by flow cytometry following ex vivo restimulation. Numbers in each quadrant represent the percent of gated CD8+ CD90.1+ T cells, and data are representative of three experiments. (B) The percent of gated CD8+ CD90.1+ or CD90.1+/CD90.2+ T cells expressing IFN-γ in differentially vaccinated Alb:Gag recipients from A is depicted graphically, with each circle representing individual mice pooled from three separate experiments. Horizontal bars represent the average for each group, and P values for select treatment groups are included.
Figure 6.
Figure 6.. PD-1 repression during inflammation occurs independently of T-bet.
CD90.1+ Gag-specific CD8+ T cells from WT or tbx21−/− donor mice were transferred separately into tolerizing Alb:Gag recipients (CD90.2+), with or without Listeria infection. (A) Three days later, cell-surface expression of PD-1 on transferred T cells was determined by flow cytometry. (B) Geometric mean fluorescence intensity (geo MFI) of PD-1 expression on WT and tbx21−/− Gag-specific T cells was averaged from three pooled experiments, and error bars represent sd. (C) Real-time PCR analysis of PD-1 (pdcd1) mRNA expression in FACS-purified WT or tbx21−/− cells, 3 days after transfer. Data are relative expression versus β-actin control. Error bars are sd of three replicate samples, and data are representative of two separate experiments.
Figure 7.
Figure 7.. T-bet expression is sufficient to induce cytolytic activity but not cytokine production within the tolerizing environment.
(A) Peripheral blood lymphocytes from 6-week-old WT and T-bet-Tg, Gag-specific CD8+ T cells were stained for CD90.1 and CD8 surface expression, and CD90.1+ CD8+ cells were assessed for intracellular T-bet protein expression. (B–D) WT or T-bet-Tg T cells were transferred into B6 or Alb:Gag recipients, with or without Listeria vaccination. Three days after T cell transfer, recipients were infused with a 1:1 ratio of Gag (eFluor 670low) and control (eFluor 670high) peptide-pulsed target cells. (B) Twenty hours later (Day 4), recipient spleens were harvested, and the frequency of transferred, Gag-specific T cells was determined by flow cytometry. The percent of CD8+ CD90.1+ T cells among total CD8+ T cells is depicted, with each circle representing individual mice pooled from two separate experiments. (C) Target-cell frequency is displayed in histograms with the percentage of total eFluor 670-positive cells inset above the indicated regions. Graph displays relative target cell killing (percent eFluor 670high/percent eFluor 670low) pooled from three independent experiments, each with three mice/group (n=9), and error bars represent sd. (D) Production of IFN-γ and TNF-α by transferred T cells was measured after overnight restimulation with the Gag peptide. Numbers in each quadrant represent the percent of gated CD8+ CD90.1+ T cells and are representative of two separate experiments, each with three mice/treatment group. (E) Intracellular T-bet expression was assessed in splenic CD8+ CD90.1+ T cells, 4 days after transfer into the indicated environments. See also Supplemental Fig. 2.
Figure 8.
Figure 8.. T-bet is required but not sufficient to overcome functional T cell tolerance during cancer immunotherapy.
Tolerizing Alb:Gag recipient mice were inoculated i.v. with FBL leukemia. Seven days later, tumor-bearing recipients were left untreated or given adoptive transfers of WT, tbx21−/−, or T-bet-Tg, Gag-specific CD8+ T cells and vaccinated as indicated. (A) Recipient survival was tracked for 40 days, and results pooled from two to three separate experiments are depicted in the graph showing survival (y-axis) over time in days (x-axis), with the number of total mice in each treatment group indicated (n). (B) CD90.1+ Gag-specific CD8+ T cells from WT donor mice were transferred into tolerizing B6 or Alb:Gag recipients (no tumor), with or without Listeria as indicated. The frequency of transferred T cells in recipient spleens was assessed after 8 days. The total number of CD90.1+ CD8+ cells is displayed graphically and shows pooled data from four independent experiments, with each circle representing data from one mouse.

Similar articles

Cited by

References

    1. Redmond W. L., Sherman L. A. (2005) Peripheral tolerance of CD8 T lymphocytes. Immunity 22, 275–284. - PubMed
    1. Teague R. M., Greenberg P. D., Fowler C., Huang M. Z., Tan X., Morimoto J., Dossett M. L., Huseby E. S., Ohlen C. (2008) Peripheral CD8+ T cell tolerance to self-proteins is regulated proximally at the T cell receptor. Immunity 28, 662–674. - PMC - PubMed
    1. Ohlen C., Kalos M., Cheng L. E., Shur A. C., Hong D. J., Carson B. D., Kokot N. C., Lerner C. G., Sather B. D., Huseby E. S., Greenberg P. D. (2002) CD8(+) T cell tolerance to a tumor-associated antigen is maintained at the level of expansion rather than effector function. J. Exp. Med. 195, 1407–1418. - PMC - PubMed
    1. Berrien-Elliott M. M., Jackson S. R., Meyer J. M., Rouskey C. J., Nguyen T. L., Yagita H., Greenberg P., Dipaolo R. J., Teague R. M. (2013) Durable adoptive immunotherapy for leukemia produced by manipulation of multiple regulatory pathways of CD8+ T cell tolerance. Cancer Res. 73, 605–616. - PMC - PubMed
    1. Kaech S. M., Wherry E. J., Ahmed R. (2002) Effector and memory T-cell differentiation: implications for vaccine development. Nat. Rev. Immunol. 2, 251–262. - PubMed

Publication types

MeSH terms