Meta-Analysis
. 2014 Jun;33(6):306-16.
doi: 10.5732/cjc.013.10248. Epub 2014 May 5.

Active and passive smoking with breast cancer risk for Chinese females: a systematic review and meta-analysis

Affiliations
Meta-Analysis

Active and passive smoking with breast cancer risk for Chinese females: a systematic review and meta-analysis

Chuan Chen et al. Chin J Cancer. 2014 Jun.

Abstract

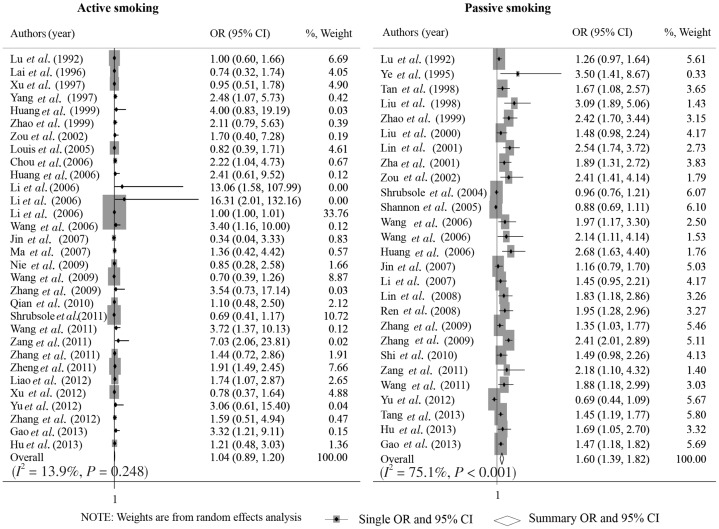
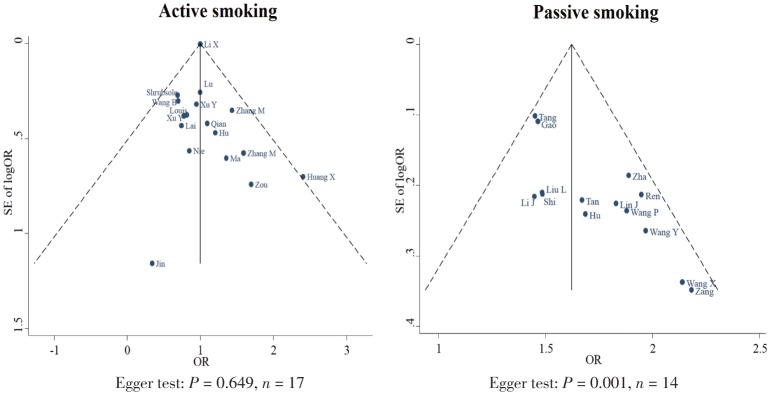
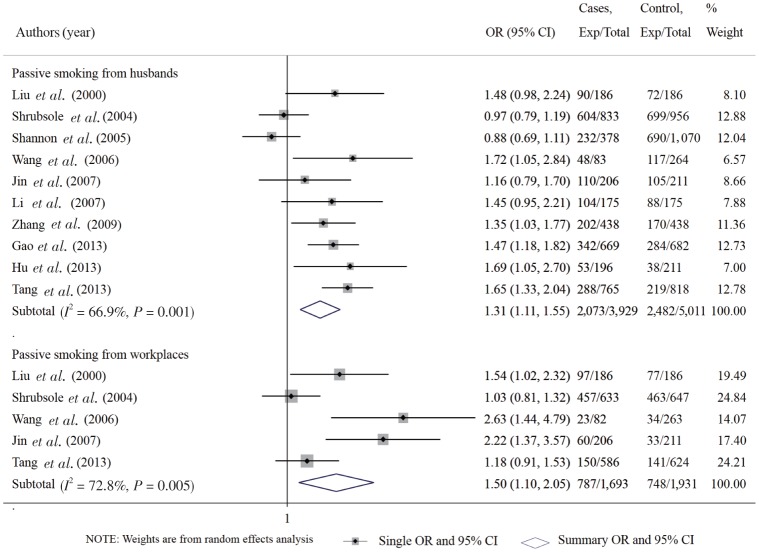
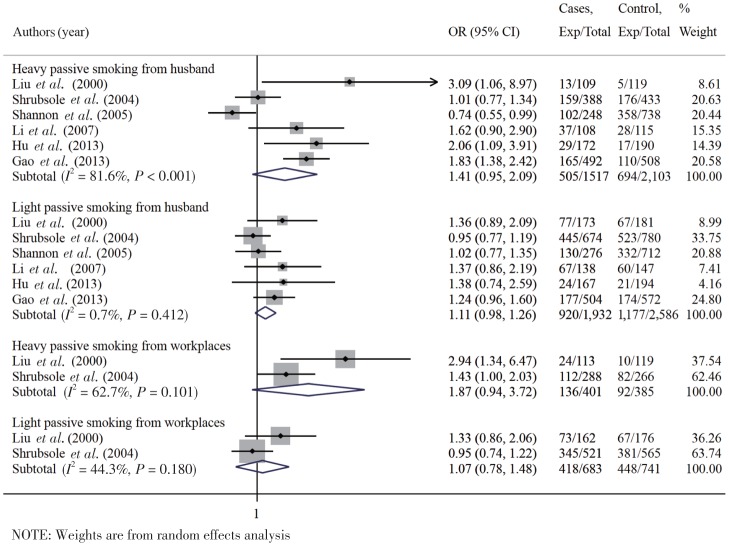
Previous studies suggested that smoking and passive smoking could increase the risk of breast cancer, but the results were inconsistent, especially for Chinese females. Thus, we systematically searched cohort and case-control studies investigating the associations of active and passive smoking with breast cancer risk among Chinese females in four English databases (PubMed, Embase, ScienceDirect, and Wiley) and three Chinese databases (CNKI, WanFang, and VIP). Fifty-one articles (3 cohort studies and 48 case-control studies) covering 17 provinces of China were finally included in this systematic review. Among Chinese females, there was significant association between passive smoking and this risk of breast cancer [odds ratio (OR): 1.62; 95% confidence interval (CI): 1.39-1.85; I2 = 75.8%, P < 0.001; n = 26] but no significant association between active smoking and the risk of breast cancer (OR: 1.04; 95% CI: 0.89-1.20; I2 = 13.9%, P = 0.248; n = 31). The OR of exposure to husband's smoking and to smoke in the workplace was 1.27 (95% CI: 1.07-1.50) and 1.66 (95% CI: 1.07-2.59), respectively. The OR of light and heavy passive smoking was 1.11 and 1.41, respectively, for women exposed to their husband's smoke (< 20 and ≥ 20 cigarettes per day), and 1.07 and 1.87, respectively, for those exposed to smoke in the workplace (< 300 and ≥ 300 min of exposure per day). These results imply that passive smoking is associated with an increased risk of breast cancer, and the risk seems to increase as the level of passive exposure to smoke increases among Chinese females. Women with passive exposure to smoke in the workplace have a higher risk of breast cancer than those exposed to their husband's smoking.


Figures

Figure 1.
Figure 1.. Forest graph on the association of active and passive smoking with breast cancer risk.
Each row in the forest graph represents the original odds ratio (OR) with 95% confidence interval (CI) reported in one study. And the last row represents the overall association of active and passive smoking with breast cancer risk.
Figure 2.
Figure 2.. Funnel plots on the association of active and passive smoking with breast cancer risk.
Each plot represents the original OR against its standard error of OR reported in one included study. The full line in the middle and the imaginary lines in the two sides represent the overall OR with 95% CI.
Figure 3.
Figure 3.. Association of active and passive smoking with breast cancer risk for different subgroups.
Each diamond represents the overall OR with 95% CI for the specific subgroups studies.
Figure 4.
Figure 4.. Forest graph on the association of active and passive smoking with breast cancer risk after adjusting for potential confounding factors.
Each row in the forest graph represents the original odds ratio (OR) with 95% confidence interval (CI) reported in one study. The diamond in the last row represents the overall OR with 95% CI.
Figure 5.
Figure 5.. Sensitivity analysis after excluding studies that fell outside of the funnel plots in the primary meta-analysis on the association of active and passive smoking with breast cancer risk.
Each row in the forest graph represents the original OR with 95% CI reported in one study. The diamond in the last row represents the overall OR with 95% CI.
Figure 6.
Figure 6.. Funnel plots based on sensitivity analysis after excluding studies that fell outside of the funnel plots in the primary meta-analysis on the association of active and passive smoking with breast cancer risk.
Each plot represents the original OR against its standard error of OR reported in one included study. The full line in the middle and the imaginary lines in the two sides represent the overall OR with 95% CI.
Figure 7.
Figure 7.. Forest graph on the association of passive smoking with breast cancer risk according to exposure to husband's smoking or to the smoke of workplace.
Each row in the forest graph represents the original OR with 95% CI reported in one study. The diamond in the last row represents the overall OR with 95% CI.
Figure 8.
Figure 8.. Forest graph on the association of passive smoking with breast cancer risk for different sources and levels of exposure.
Each row in the forest graph represents the original OR with 95% CI reported in one study. The diamond in the last row represents the overall OR with 95% CI.

References

    1. Chen W, Zheng R, Zeng H, et al. Trend analysis and projection of cancer incidence in China between 1989 and 2008. Zhonghua Zhong Liu Za Zhi. 2012;7:517–524. [in Chinese] - PubMed
    1. Gu D, Kelly T, Wu X, et al. Mortality attributable to smoking in China. N Engl J Med. 2009;360:150–159. - PubMed
    1. Gan Q, Smith K, Hammond S, et al. Disease burden of adult lung cancer and ischaemic heart disease from passive tobacco smoking in China. Tobacco control. 2007;16:417–422. - PMC - PubMed
    1. Yang G, Fan L, Tan J, et al. Smoking in China: findings of the 1996 national prevalence survey. JAMA. 1999;282:1247–1253. - PubMed
    1. Li Q, Hsia J, Yang G. Prevalence of smoking in China in 2010. N Engl J Med. 2011;364:2469–2470. - PubMed

Publication types

Substances