. 2014 Oct;16(10):1549-64.
doi: 10.1111/cmi.12311. Epub 2014 Jun 13.

Cell-to-cell transfer of Leishmania amazonensis amastigotes is mediated by immunomodulatory LAMP-rich parasitophorous extrusions

Affiliations

Cell-to-cell transfer of Leishmania amazonensis amastigotes is mediated by immunomodulatory LAMP-rich parasitophorous extrusions

Fernando Real et al. Cell Microbiol. 2014 Oct.

Abstract

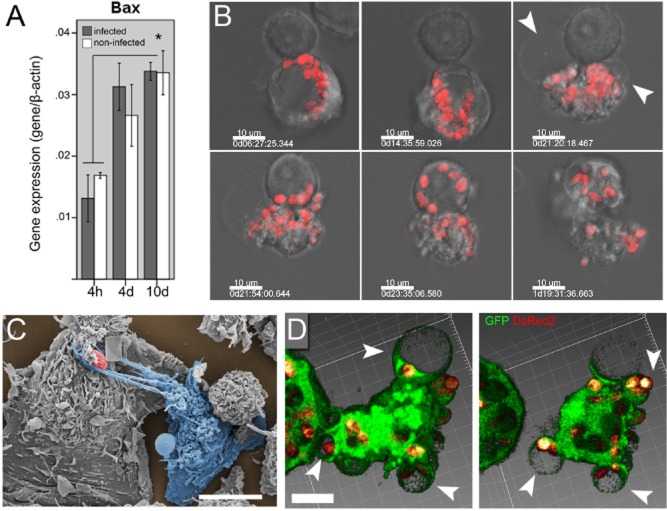
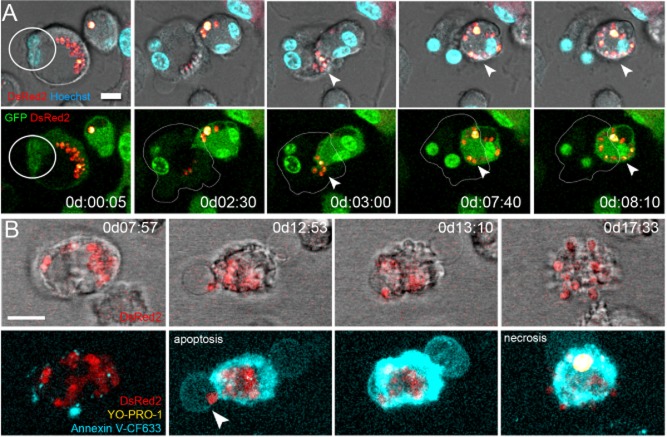
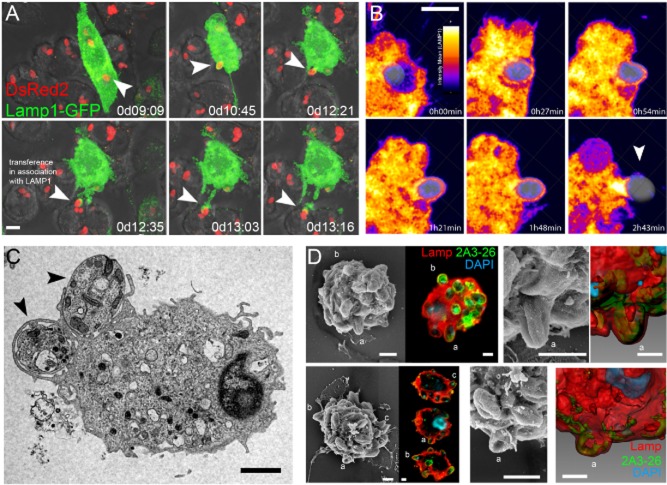
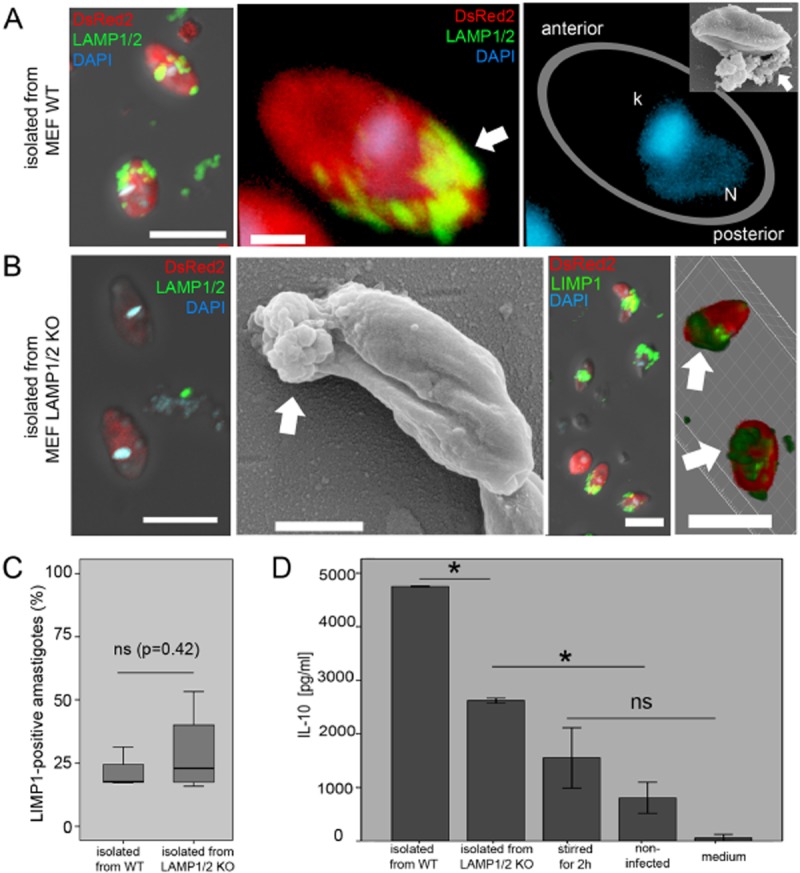
The last step of Leishmania intracellular life cycle is the egress of amastigotes from the host cell and their uptake by adjacent cells. Using multidimensional live imaging of long-term-infected macrophage cultures we observed that Leishmania amazonensis amastigotes were transferred from cell to cell when the donor host macrophage delivers warning signs of imminent apoptosis. They were extruded from the macrophage within zeiotic structures (membrane blebs, an apoptotic feature) rich in phagolysosomal membrane components. The extrusions containing amastigotes were selectively internalized by vicinal macrophages and the rescued amastigotes remain viable in recipient macrophages. Host cell apoptosis induced by micro-irradiation of infected macrophage nuclei promoted amastigotes extrusion, which were rescued by non-irradiated vicinal macrophages. Using amastigotes isolated from LAMP1/LAMP2 knockout fibroblasts, we observed that the presence of these lysosomal components on amastigotes increases interleukin 10 production. Enclosed within host cell membranes, amastigotes can be transferred from cell to cell without full exposure to the extracellular milieu, what represents an important strategy developed by the parasite to evade host immune system.


Figures

Fig 1
Fig 1
Cell-to-cell transfer of Leishmania amazonensis amastigotes occurred after host cell death.A. Pro-apoptotic Bax gene mRNA expression measured by qPCR in infected or non-infected BMDMØ after 4 h, 4 and 10 days after L. amazonensis infection. The data are presented as the relative quantification 2−ΔΔCt against β-actin gene expression. There was an increase in Bax expression after 4 and 10 days, independent of infection. anova, P < 0.05.B. Live cell imaging of BMDMØ infected with L. amazonensis-DsRed2 (red) for 30 days in vitro and co-cultured with uninfected RAW 264.7 macrophage-like cells. RAW cell interacts with infected BMDMØ and rescue several amastigotes after macrophage collapse. Host cell death presented zeiosis (arrowheads), a typical feature of apoptosis. The time of image acquisition is represented by days:hours:minutes:seconds:milliseconds (d:hh:mm:ss:sss). Image acquisition started after 2 h of RAW cell addition. Bar = 10 μm.C. Field-emission scanning electron microscopy (FE-SEM) of a BMDMØ culture infected with L. amazonensis-DsRed2 for 20 days, showing a macrophage (coloured in blue) interacting with an oval-shaped structure (red) extruded from a vicinal macrophage. This structure presents dimensions compatible with an amastigote. Bar = 10 μm.D. Amastigotes (red) are extruded from dying BMDMØ-GFP (green) within zeiotic structures (blebs). Images are representative of two z-stacks of the same macrophage and the arrowheads indicate parasite-containing extrusions. Bar = 10 μm. Results are representative of two experiments.
Fig 2
Fig 2
Quantification of amastigote transfer events and host cell numbers during multidimensional acquisition of BMDMØ infected with L. amazonensis-DsRed2.A. Example of L. amazonensis-DsRed2 cell-to-cell transfer recorded between BMDMØ infected for 15 days. The image shows the macrophages involved in transfer (arrowheads), classified as donor (a macrophage from which parasites are extruded and transferred after host cell death) and recipient (viable macrophages in the vicinity which rescue extruded parasites from donor). Upper panel: at time point 1d07:45 amastigotes are relocated to a macrophage extrusion; recipient macrophages take up these extruded parasites at time points 1d08:45 and 1d09:00 (asterisks indicate regions of parasite transfers). L. amazonensis-DsRed2 in red, Hoechst 33342 staining in cyan channel. Lower panel: amastigotes were tracked during transfer, in an interval of 2 h after amastigote extrusion; parasites displacement in x, y and z dimensions is depicted as tracing lines in each time point. Tracing lines display a colorimetric range, relative to the start (extrusion, t = 0 h, time point 1d07:45, black-blue tracing) and the end of tracking (complete transfer, time point 1d09:45, yellow-white tracing). Macrophage nuclei (Hoechst 33342 staining) in cyan, software-detected amastigotes (isospots) in red squares. Displayed time corresponds to image acquisition elapsed time, after 15 days of infection. Bars = 20 μm.B. Example of a microscopic field of infected culture showing in the first DIC image merged with red (L. amazonensis-DsRed2) and blue (Hoechst 33342) fluorescence channels and in the second image the automated recognition of macrophage nuclei by software analysis (yellow = counting hit), employed to quantify the number of host cells during multidimensional imaging. This automatic quantification was applied to 10 multidimensional images of infected and non-infected cultures, acquired after 15 of infection, for additional 70 h. Right panel (graph): quantified nuclei of infected and non-infected BMDMØ cultures were plotted in the graph, which shows the mean (with standard error) number of macrophage nuclei per microscopic field (40× objective, 228 × 228 μm).C. Anti-apoptotic genes IGF-I and Bcl-2 mRNA expression measured by qPCR in infected or non-infected BMDMØ after 4 h, 4 and 10 days after L. amazonensis infection. The data are presented as the relative quantification 2−ΔΔCt against β-actin gene expression. Infected cell cultures express higher levels of IGF-I and Bcl-2 after 10 days of infection. anova, P < 0.05.D. Quantification of amastigote transfer events (red dots) per microscopic field (40× objective, 228 × 228 μm, n = 9). A median of 12 transfers per field was observed in live cell recordings.
Fig 3
Fig 3
Micro-irradiation of host cell nuclei induced cell death and amastigote transfer.A. Time-lapse frames of a micro-irradiated BMDMØ-GFP transferring amastigotes (arrowheads) to non-irradiated macrophages. Upper panels: Leishmania amazonensis-DsRed2 in red and Hoechst 33342 in cyan, merged with DIC image. Lower panels: green (GFP signal from macrophages) and red channels of the same region, showing GFP leakage of the micro-irradiated cells (contour) during amastigote transfers (arrowhead). The micro-irradiation spot is indicated by a white circle. Image acquisition started after 120 h of infection plus 5 min of micro-irradiation.B. Multidimensional live imaging of micro-irradiated, 48 h infected BMDMØ in the presence of the phosphatidylserine (PS) probe Annexin V (conjugated to CF633 flurophore, cyan) and the cell membrane-impermeant nucleic probe YO-PRO-1 Iodide (yellow). At time point 0d12:53, during macrophage apoptosis (Annexin V-positive, YO-PRO-1-negative staining), L. amazonensis–DsRed2 amastigotes (red) are relocated to zeiotic structures which expose PS (arrowhead); the host cell starts necrosis around 0d14:00 (YO-PRO-1 staining is indicative of loss of membrane integrity). Time of image acquisition is represented by days:hours:minutes (d:hh:mm). Bar = 10 μm.
Fig 4
Fig 4
Amastigotes were transferred from cell to cell associated with phagolysosomal components.A. Multidimensional imaging of RAW 264.7 cells expressing GFP-tagged LAMP1 (in green) and infected with Leishmania amazonensis-DsRed2 (red) for 24 h. Arrowheads indicate an extruded amastigote rescued by vicinal macrophage. Time of image acquisition is represented by days:hours:minutes (d:hh:mm). Image acquisition started after 24 h of infection plus 2 min of micro-irradiation. Bars = 10 μm.B. The temporal sequence of the extrusion event presented in A shows that amastigote is surrounded by LAMP1 (hue-saturation-value filter, colorimetric scale relative to mean fluorescence intensity) during the first hours of extrusion. Later, the extrusion concentrates LAMP1 on an amastigote pole (arrowhead). Relative time of extrusion is represented by hours:minutes (h:mm). Extruded amastigote is indicated by an isosurface (grey) constructed by imaging software, based on DsRed2 signal. Bar = 5 μm.C. TEM of two amastigotes (arrowheads) extruded from an apoptotic macrophage. The host cell presents apoptotic features such as shrinkage and peripheral chromatin condensation in a deformed nucleus. Amastigotes are fully (left arrowhead) or partially (right arrowhead) exposed to extracellular milieu. Bar = 2 μm.D. Correlative imaging of infected macrophages extruding amastigotes. The image presents two examples (upper and lower panels) of macrophages observed under confocal and then FE-SEM. For the observation by confocal microscopy, cells were immunostained with combined LAMP1/LAMP2 antibodies (red channels), L. amazonensis-specific antibody (2A3-26, green channels) and stained with DAPI (blue channel). Extruded amastigotes are indicated by letters a, b and c. In the lower panel, the confocal images are presented in different focal planes to show the indicated amastigote extrusions. The membrane covering the extruding amastigotes (A) is observed at higher magnification and resolution in these two examples and displays a smooth aspect with no evident pores. The same extrusion observed by confocal microscopy revealed that extruded amastigotes are fully covered with LAMPs. Bars = 2 μm.Results are representative of four (A–B) and two (C–D) experiments.
Fig 5
Fig 5
Fibroblast-derived amastigotes associated with LAMP stimulate interleukin-10 (IL-10) production by macrophages.A. L. amazonensis-DsRed2 amastigotes (red) isolated from wild-type mouse embryonic fibroblasts (MEF-WT) preserved LAMP1 and LAMP2 proteins (immunostained with LAMP1/LAMP2 antibodies, green) on their surfaces. First image: DIC merged with green, red and blue (DAPI) channels, bar = 5 μm. Second and third images: three-dimensional reconstructions of an amastigote showing LAMP cap at the parasite posterior pole (arrow). The position of parasite nucleus (N) and kinetoplast (k) indicate amastigote polarity. Bar = 1 μm. Inset: field-emission scanning electron microscopy (FE-SEM) of an amastigote and associated membrane debris (arrow) at the posterior pole, bar = 2 μm.B. L. amazonensis-DsRed2 amastigotes (red) isolated from LAMP1/LAMP2 knockout MEF. First image show DIC merged green, red and blue (DAPI) channels of amastigotes incubated with LAMP1/LAMP2 antibodies (green): amastigotes are devoid of a LAMP cap on their surfaces, bar = 5 μm; second image acquired by FE-SEM reveals membrane debris at their posterior poles, bar = 2 μm. Third and fourth images: immunostaining of LIMP1 (green) revealed that the membrane cap on the amastigote surface conserves lysosomal components; three-dimensional reconstruction of amastigotes (fourth image) shows LIMP cap on parasite poles (arrows), bar = 5 μm.C. Flow cytometry quantification of the percentage of amastigotes positive for LIMP-1. Amastigotes were isolated from MEF-WT or MEF-LAMP1/2KO, after 48 h of infection. LIMP-1 is presented on approximately 20% of amastigotes (P > 0.05, anova).D. IL-10 production by BMDMØ cultures infected with amastigotes isolated from MEF-WT (LAMP-associated) or from MEF-LAMP1/LAMP2 KO (LAMP-devoid amastigotes); medium alone, non-infected macrophage cultures and amastigotes cultivated under agitation for 2 h (stirred amastigotes) were employed as experimental controls. LAMP-associated amastigotes stimulate a higher production of IL-10 when compared with LAMP-devoid parasites, which, in turn, induce a higher production of the cytokine when compared with control groups. anova, P < 0.05. Data representative of three independent experiments.

Similar articles

Cited by

References

    1. Alvarez M. Casadevall A. Phagosome extrusion and host-cell survival after Cryptococcus neoformans phagocytosis by macrophages. Curr Biol. 2006;16:2161–2165. - PubMed
    1. Alvarez M. Casadevall A. Cell-to-cell spread and massive vacuole formation after Cryptococcus neoformans infection of murine macrophages. BMC Immunol. 2007;8:16. - PMC - PubMed
    1. Arruda DC, Santos LC, Melo FM, Pereira FV, Figueiredo CR, Matsuo AL, et al. beta-Actin-binding complementarity-determining region 2 of variable heavy chain from monoclonal antibody C7 induces apoptosis in several human tumor cells and is protective against metastatic melanoma. J Biol Chem. 2012;287:14912–14922. - PMC - PubMed
    1. Buxbaum LU. Scott P. Interleukin 10- and Fcgamma receptor-deficient mice resolve Leishmania mexicana lesions. Infect Immun. 2005;73:2101–2108. - PMC - PubMed
    1. Carlsen ED, Hay C, Henard CA, Popov V, Garg NJ. Soong L. Leishmania amazonensis amastigotes trigger neutrophil activation but resist neutrophil microbicidal mechanisms. Infect Immun. 2013;81:3966–3974. - PMC - PubMed

Publication types