. 2014 May 13;9(5):e97101.
doi: 10.1371/journal.pone.0097101. eCollection 2014.

Visualizing typical features of breast fibroadenomas using phase-contrast CT: an ex-vivo study

Affiliations

Visualizing typical features of breast fibroadenomas using phase-contrast CT: an ex-vivo study

Susanne Grandl et al. PLoS One. .

Abstract

Background: Fibroadenoma is the most common benign solid breast lesion type and a very common cause for histologic assessment. To justify a conservative therapy, a highly specific discrimination between fibroadenomas and other breast lesions is crucial. Phase-contrast imaging offers improved soft-tissue contrast and differentiability of fine structures combined with the potential of 3-dimensional imaging. In this study we assessed the potential of grating-based phase-contrast CT imaging for visualizing diagnostically relevant features of fibroadenomas.

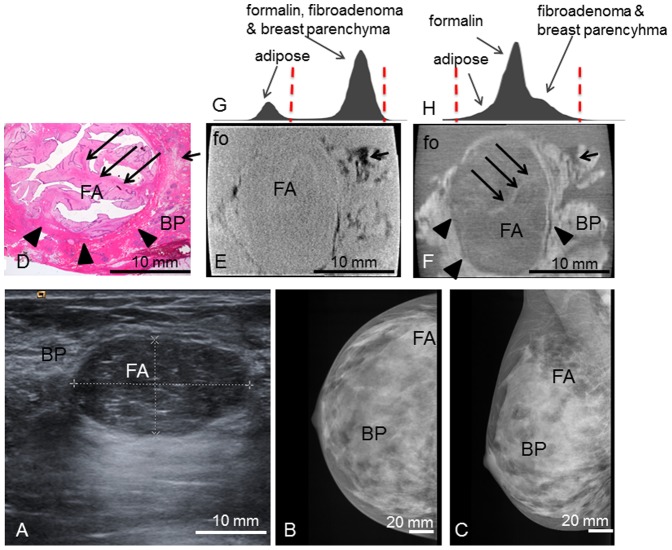
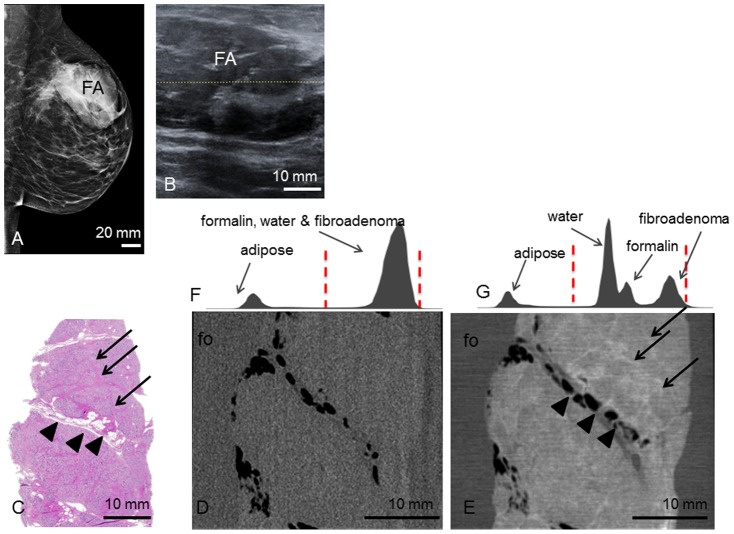
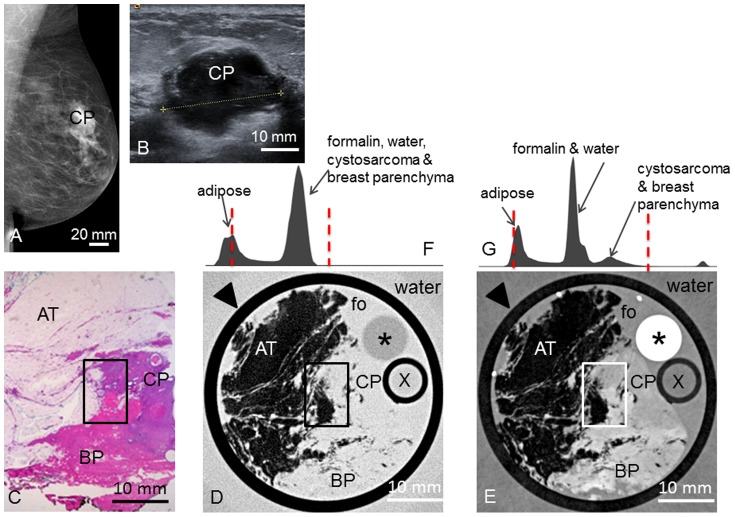
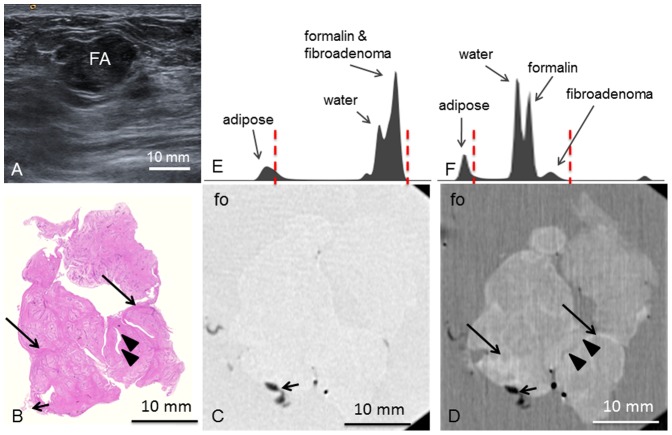
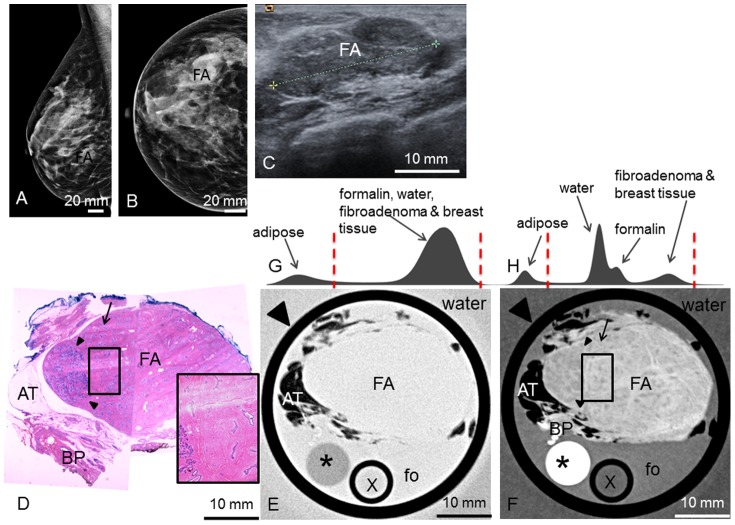
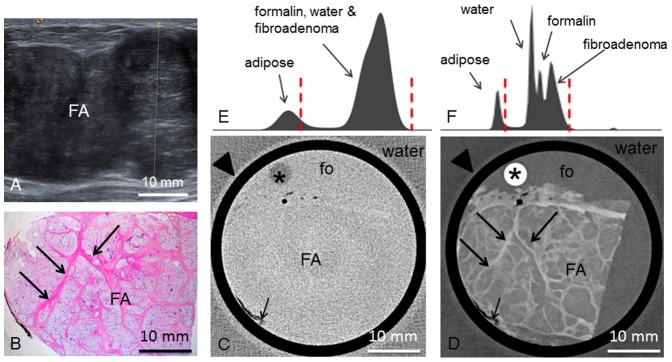
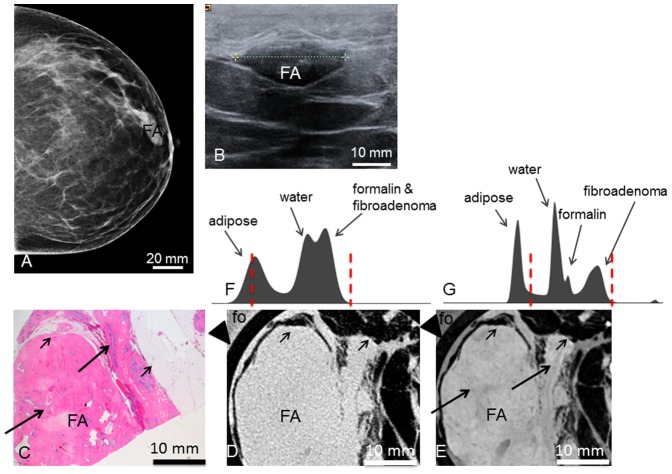
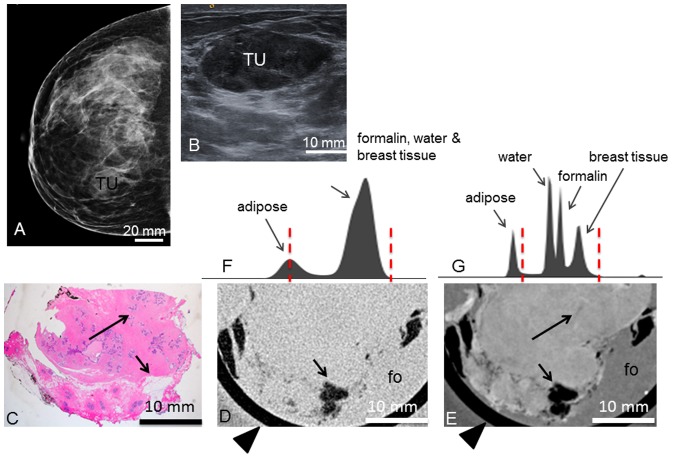
Materials and methods: Grating-based phase-contrast CT was performed on six ex-vivo formalin-fixed breast specimens containing a fibroadenoma and three samples containing benign changes that resemble fibroadenomas using Talbot Lau interferometry and a polychromatic X-ray source. Phase-contrast and simultaneously acquired absorption-based 3D-datasets were manually matched with corresponding histological slices. The visibility of diagnostically valuable features was assessed in comparison with histology as the gold-standard.

Results: In all cases, matching of grating-based phase-contrast CT images and histology was successfully completed. Grating-based phase-contrast CT showed greatly improved differentiation of fine structures and provided accurate depiction of strands of fibrous tissue within the fibroadenomas as well as of the diagnostically valuable dilated, branched ductuli of the fibroadenomas. A clear demarcation of tumor boundaries in all cases was provided by phase- but not absorption-contrast CT.

Conclusions: Pending successful translation of the technology to a clinical setting and considerable reduction of the required dose, the data presented here suggest that grating-based phase-contrast CT may be used as a supplementary non-invasive diagnostic tool in breast diagnostics. Phase-contrast CT may thus contribute to the reduction of false positive findings and reduce the recall and core biopsy rate in population-based screening. Phase-contrast CT may further be used to assist during histopathological workup, offering a 3D view of the tumor and helping to identify diagnostically valuable tissue sections within large tumors.


Conflict of interest statement

Competing Interests: The authors have declared that no competing interests exist.

Figures

Figure 1
Figure 1. Preoperative imaging, histology, absoption- and phase-contrast CT of case 1.
Preoperative ultrasonography (A) with typical benign imaging characteristics of the fibroadenoma (FA) (oval form, smooth margins, posterior enhancement); preoperative craniocaudal (B) and mediolateral oblique (C) mammography projections show the fibroadenoma (FA) partially hidden within the dense breast parenchyma (BP) (ACR IV). Representative histological slice (D) and corresponding absorption- (E) and phase-contrast CT (F) image. (G) and (H) show the histograms of the whole 3D volume dataset of the absorption- and phase-contrast CT, respectively: The peaks in (H) correspond to the different grey levels of formalin (fo), FA and surrounding breast parenchyma (BP). The “shoulder” of the histogram in (H) corresponds to adipose tissue. In (G), only two distinct peaks for adipose tissue and formalin, FA and breast parenchyma are seen. Window levels are marked with dashed red lines. The tumor boundaries are indicated by arrowheads; one sclerotic strand is indicated by long arrows. Adipose tissue is indicated by short arrows. The black sharp lines in the corners of (E) and (F) correspond to the walls of the plastic container. The ducts are artificially torn open in (D) due to cutting and staining procedures.
Figure 2
Figure 2. Preoperative imaging, histology, absoption- and phase-contrast CT of case 2.
Preoperative mediolateral oblique mammogram (A) shows the fibroadenoma (FA) within a transparent breast (ACR II). Ultrasonography (B) of the FA. Representative histological slice (C) of the FA. Corresponding absorption- (D) and phase-contrast CT (E) slice. Arrowheads indicate septum with interspersed adipose tissue. Arrows indicate sclerotic strands. (F) and (G) show the histograms of the whole 3D volume dataset of the absorption- and phase-contrast CT, respectively. In (F), only two distinct peaks for adipose tissue and formalin (fo), water and FA are seen. In (G), there are four distinct peaks for adipose tissue, water, formalin and FA. Window levels are marked with dashed red lines.
Figure 3
Figure 3. Preoperative imaging, histology, absoption- and phase-contrast CT of case 3.
Preoperative mediolateral oblique mammogram (A) shows the cystosarcoma phyllodes (CP) within a transparent breast (ACR II). Ultrasonography (B) of the CP. Representative histological slice (C) of the CP. Corresponding absorption- (D) and phase-contrast CT (E) slice. Rectangle in (C), (D) and (E) indicates the borders between adipose tissue (AT), CP and breast parenchyma (BP). (F) and (G) show the histograms of the whole 3D volume dataset of the absorption- and phase-contrast CT, respectively, with only two distinct peaks for adipose tissue and formalin (fo), water, CP and BP in (F) and different grey levels for adipose tissue, formalin & water, CP & BP in (G). Window levels are marked with dashed red lines. Arrowheads in (D) and (E) indicate plastic container surrounding the sample. Asterisk (*) indicates polymethylmethacrylate (PMMA) stick, X indicates plastic tube filled with water; both materials can be used for calibration in quantitative studies (not used here).
Figure 4
Figure 4. Preoperative imaging, histology, absorption- and phase-contrast CT of case 4.
Preoperative ultrasonography (A) shows the fibroadenoma (FA) as lobulated mass with smooth margins. Representative histological slice (B) and corresponding absorption- (C) and phase-contrast CT slice (D). (D) show strands of hypocellular sclerosis (long arrows) as well as torn-open ducts (arrowheads) filled with formalin. Adhering adipose tissue indicated by short arrow. Histograms of the whole 3D volume dataset of the absorption- (E) and phase-contrast (F) CT, respectively, show distinct peaks for adipose tissue, water, formalin (fo) and FA in (F) whereas in (E), the peaks for water, formalin and FA overlap. Window levels are marked with dashed red lines.
Figure 5
Figure 5. Preoperative imaging, histology, absorption- and phase-contrast CT of case 5.
Preoperative mediolateral-oblique (A) and craniocaudal (B) mammogram and ultrasonography (C) showing the fibroadenoma (FA). Representative histological slice (D) showing the FA, surrounded by adipose tissue (AT) and breast parenchyma (BP). Absorption- (E) and phase-contrast CT (F) slice; black rectangle showing zoomed view of a polygonal sclerotic frame (pink in (D), bright in (F) filled with basophilic branched ducts; one linear duct indicated by arrow in (D) and (F). (G) and (H) show the histograms of the whole 3D volume dataset of the absorption- and phase-contrast CT, respectively, with only two distinct peaks for adipose tissue and formalin (fo), water, fibroadenoma and breast tissue in (G) and different grey levels for adipose tissue, water, formalin and fibroadenoma & breast tissue in (H). Window levels are marked with dashed red lines. Arrowheads in (E) and (F) indicate plastic container surrounding the sample. Asterisk (*) indicates polymethylmethacrylate (PMMA) stick, X indicates plastic tube filled with water; both materials can be used for calibration in quantitative studies (not used here).
Figure 6
Figure 6. Preoperative imaging, histology, absorption- and phase-contrast CT of case 6.
Preoperative ultrasonography (A) of the fibroadenoma (FA). Representative histological slice (B) of the FA. Corresponding absorption- (C) and phase-contrast CT (D) slice. Long arrows indicate strands of fibrous tissue. Short arrows indicate adhering adipose tissue. (E) and (F) show the histograms of the whole 3D volume dataset of the absorption- and phase-contrast CT, respectively. In (E), only two distinct peaks for adipose tissue and formalin (fo), water and FA are seen. whereas in (F), the histogram reveals four distinct peaks for adipose tissue, water, formalin and fibroadenoma. Window levels are marked with dashed red lines. Arrowheads in (C) and (D) indicate plastic container surrounding the sample.
Figure 7
Figure 7. Preoperative imaging, histology, absorption- and phase-contrast CT of case 7.I.
Preoperative craniocaudal mammography (A) and ultrasonography (B) of the fibroadenoma (FA). Representative histological slice (C) of the FA. Corresponding absorption- (D) and phase-contrast CT (E) slice. Long arrows indicating ducts. Short arrows indicate adhering adipose tissue. (F) and (G) show the histograms of the whole 3D volume dataset of the absorption- and phase-contrast CT, respectively. In (F), only two distinct peaks for adipose tissue and water, formalin (fo) and FA are seen. In (G), there are four distinct peaks for adipose tissue, water, formalin and FA. Window levels are marked with dashed red lines. Arrowheads in (D) and (E) indicate plastic container surrounding the sample.
Figure 8
Figure 8. Preoperative imaging, histology, absorption- and phase-contrast CT of case 8.
Preoperative craniocaudal mammography (A) and ultrasonography (B) of the tumor (TU) containing a pseudoangiomatous stromal hyperplasia. Representative histological slice (C) of the tumor. Corresponding absorption- (D) and phase-contrast CT (E) slice. Long arrows indicating ducts. Short arrows indicate adhering adipose tissue. (F) and (G) show the histograms of the whole 3D volume dataset of the absorption- and phase-contrast CT, respectively. In (F), only two distinct peaks for adipose tissue and formalin, water and breast tissue are seen. In (G), there are four distinct peaks for adipose tissue, water, formalin and breast tissue. Window levels are marked with dashed red lines. Arrowheads in (D) and (E) indicate plastic container surrounding the sample.
Figure 9
Figure 9. Preoperative imaging, histology, absorption- and phase-contrast CT of case 9.
Preoperative ultrasonography (A) of the tumor (TU). Representative histological slice (B) of the mastopathic area (MP with adhering adipose tissue (AT). Corresponding absorption- (C) and phase-contrast CT (D) slice. (E) and (F) show the histograms of the whole 3D volume dataset of the absorption- and phase-contrast CT, respectively. In (E), only two distinct peaks for adipose tissue and formalin (fo), water and breast tissue are seen. In (F), there are four distinct peaks for adipose tissue, water, formalin and breast tissue. Window levels are marked with dashed red lines. Arrowheads in (C) and (D) indicate plastic container surrounding the sample.

Similar articles

Cited by

References

    1. Pearlman MD, Griffin JL (2010) Benign breast disease. Obstet Gynecol 116: 747–758. - PubMed
    1. Weaver DL, Rosenberg RD, Barlow WE, Ichikawa L, Carney PA, et al. (2006) Pathologic findings from the Breast Cancer Surveillance Consortium: population-based outcomes in women undergoing biopsy after screening mammography. Cancer 106: 732–742. - PubMed
    1. Kerlikowske K, Smith-Bindman R, Ljung BM, Grady D (2003) Evaluation of abnormal mammography results and palpable breast abnormalities. Ann Intern Med 139: 274–284. - PubMed
    1. Veltman J, Mann R, Kok T, Obdeijn IM, Hoogerbrugge N, et al. (2008) Breast tumor characteristics of BRCA1 and BRCA2 gene mutation carriers on MRI. Eur Radiol 18: 931–938. - PMC - PubMed
    1. Tilanus-Linthorst M, Verhoog L, Obdeijn IM, Bartels K, Menke-Pluymers M, et al. (2002) A BRCA1/2 mutation, high breast density and prominent pushing margins of a tumor independently contribute to a frequent false-negative mammography. Int J Cancer 102: 91–95. - PubMed

Publication types