

Transcriptomics of the fetal hypothalamic response to brachiocephalic occlusion and estradiol treatment
- PMID: 24824211
- PMCID: PMC4101578
- DOI: 10.1152/physiolgenomics.00186.2013
Transcriptomics of the fetal hypothalamic response to brachiocephalic occlusion and estradiol treatment
Abstract
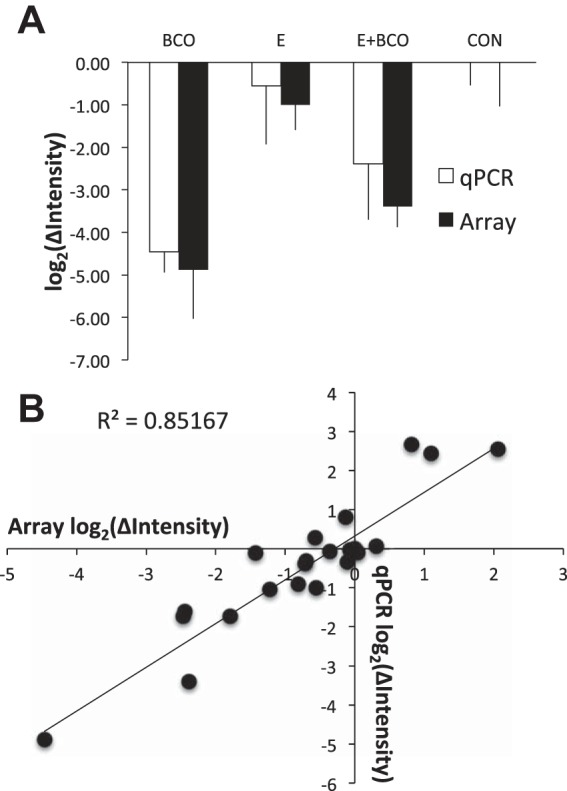
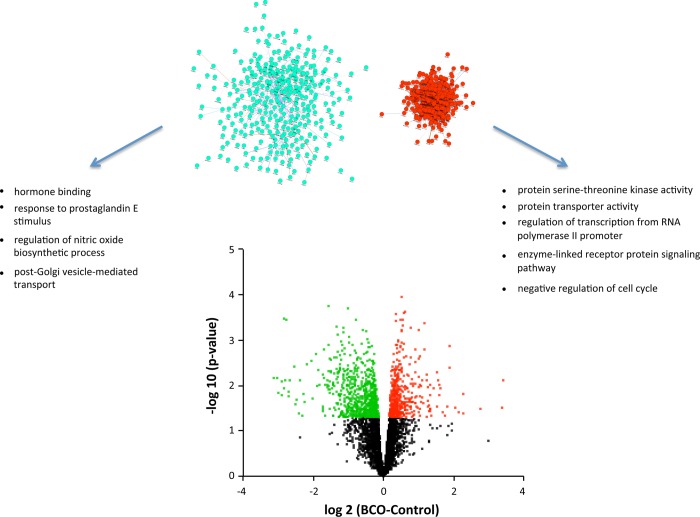
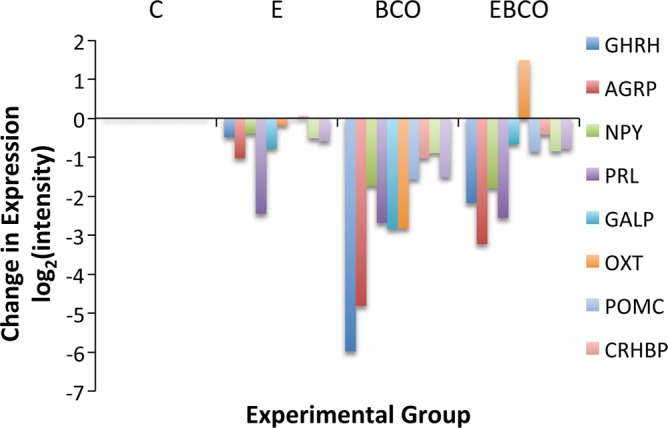
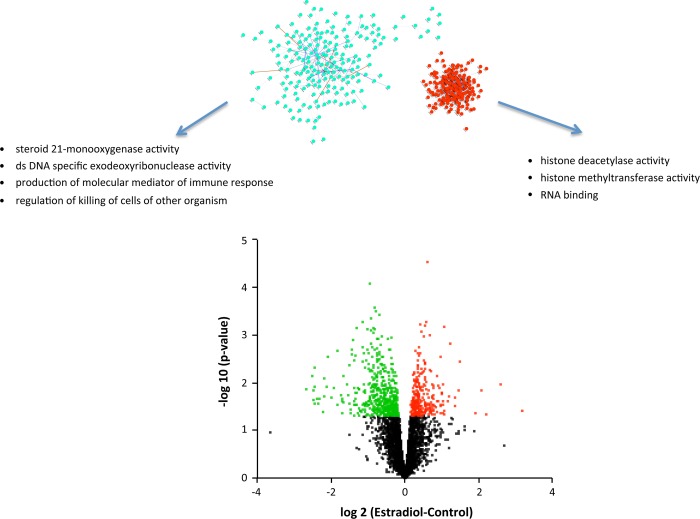
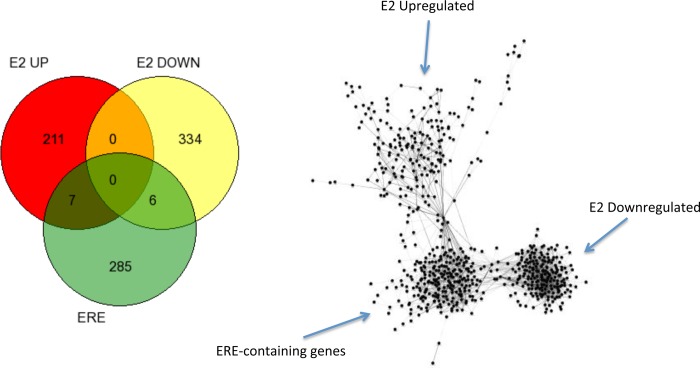
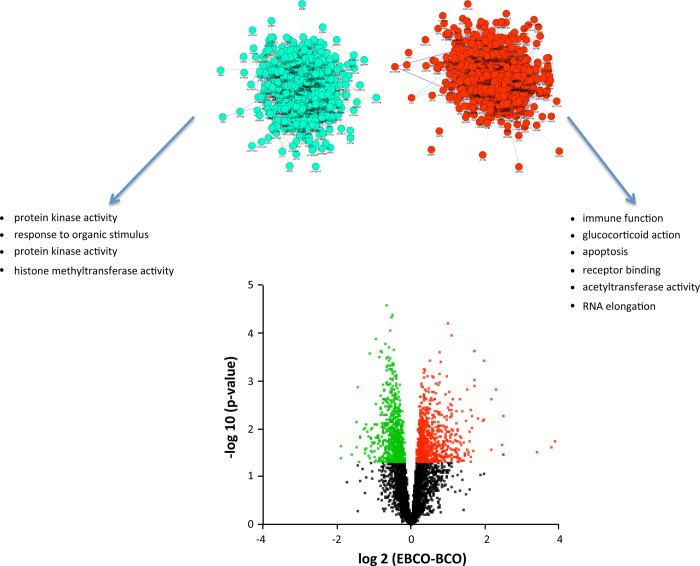
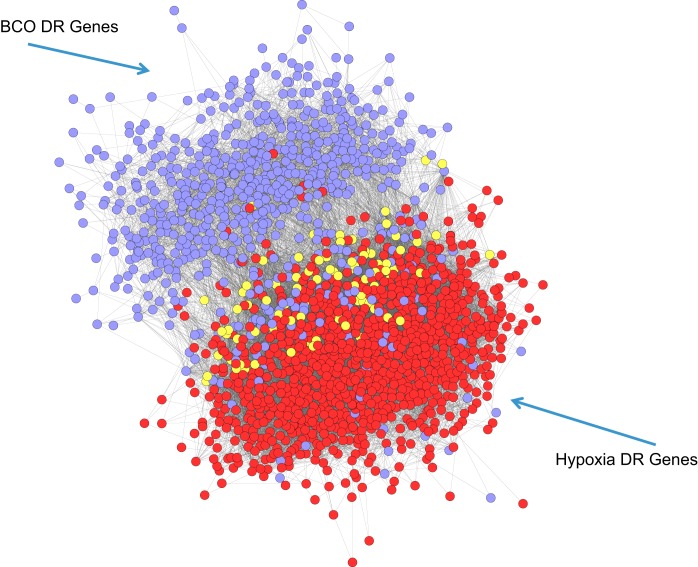
Estradiol (E2) is a well-known modulator of fetal neuroendocrine activity and has been proposed as a critical endocrine signal readying the fetus for birth and postnatal life. To investigate the modulatory role of E2 on fetal stress responsiveness and the response of the fetal brain to asphyxic stress, we subjected chronically catheterized fetal sheep to a transient (10 min) brachiocephalic artery occlusion (BCO) or sham occlusion. Half of the fetuses received subcutaneous pellets that increased plasma E2 concentrations within the physiological range. Hypothalamic mRNA was analyzed using the Agilent 8x15k ovine array (019921), processed and annotated as previously reported by our laboratory. Analysis of the data by ANOVA revealed that E2 differentially regulated (DR) 561 genes, and BCO DR 894 genes compared with control and E2+BCO DR 1,153 genes compared with BCO alone (all P < 0.05). E2 upregulated epigenetic pathways and downregulated local steroid biosynthesis but did not significantly involve genes known to directly respond to the estrogen receptor. Brachiocephalic occlusion upregulated kinase pathways as well as genes associated with lymphocyte infiltration into the brain and downregulated neuropeptide synthesis. E2 upregulated immune- and apoptosis-related pathways after BCO and reduced kinase and epigenetic pathway responses to the BCO. Responses to BCO are different from responses to hypoxic hypoxia suggesting that mechanisms of responses to these two forms of brain hypoxia are distinct. We conclude that cerebral ischemia caused by BCO might stimulate lymphocyte infiltration into the brain and that this response appears to be modified by estradiol.
Keywords: cortisol; fetal heart; late gestation; metabolism; mitochondria.
Copyright © 2014 the American Physiological Society.
Figures
Similar articles
-
Influence of estradiol and fetal stress on luteinizing hormone, follicle-stimulating hormone, and prolactin in late-gestation fetal sheep.Neonatology. 2011;100(2):155-61. doi: 10.1159/000324431. Epub 2011 Mar 24. Neonatology. 2011. PMID: 21430392 Free PMC article.
-
Cerebral hypoperfusion increases estrogen receptor abundance in the ovine fetal brain and pituitary.Neuroendocrinology. 2008;87(4):216-22. doi: 10.1159/000112844. Epub 2007 Dec 21. Neuroendocrinology. 2008. PMID: 18160819 Free PMC article.
-
Fetal brain regional responses to cerebral hypoperfusion: modulation by estrogen.Brain Res. 2003 Dec 12;993(1-2):84-9. doi: 10.1016/j.brainres.2003.09.001. Brain Res. 2003. PMID: 14642833
-
Estrogen/hypothalamus-pituitary-adrenal axis interactions in the fetus: The interplay between placenta and fetal brain.J Soc Gynecol Investig. 2005 Feb;12(2):67-76. doi: 10.1016/j.jsgi.2004.10.011. J Soc Gynecol Investig. 2005. PMID: 15695100 Review.
-
Neurotrophic factors and estradiol interact to control axogenic growth in hypothalamic neurons.Ann N Y Acad Sci. 2003 Dec;1007:306-16. doi: 10.1196/annals.1286.029. Ann N Y Acad Sci. 2003. PMID: 14993063 Review.
Cited by
-
Ketamine decreases inflammatory and immune pathways after transient hypoxia in late gestation fetal cerebral cortex.Physiol Rep. 2016 Mar;4(6):e12741. doi: 10.14814/phy2.12741. Epub 2016 Mar 31. Physiol Rep. 2016. PMID: 27033443 Free PMC article.
-
A transcriptomics model of estrogen action in the ovine fetal hypothalamus: evidence for estrogenic effects of ICI 182,780.Physiol Rep. 2018 Sep;6(18):e13871. doi: 10.14814/phy2.13871. Physiol Rep. 2018. PMID: 30221477 Free PMC article.
-
Ketamine suppresses hypoxia-induced inflammatory responses in the late-gestation ovine fetal kidney cortex.J Physiol. 2016 Mar 1;594(5):1295-310. doi: 10.1113/JP271066. Epub 2015 Nov 15. J Physiol. 2016. PMID: 26497972 Free PMC article.
-
Current paradigms and new perspectives on fetal hypoxia: implications for fetal brain development in late gestation.Am J Physiol Regul Integr Comp Physiol. 2019 Jul 1;317(1):R1-R13. doi: 10.1152/ajpregu.00008.2019. Epub 2019 Apr 24. Am J Physiol Regul Integr Comp Physiol. 2019. PMID: 31017808 Free PMC article. Review.
-
Gestational Hypoxia and Developmental Plasticity.Physiol Rev. 2018 Jul 1;98(3):1241-1334. doi: 10.1152/physrev.00043.2017. Physiol Rev. 2018. PMID: 29717932 Free PMC article. Review.
References
-
- Benjamini Y, Hochberg Y. Controlling the false discovery rate: a practical and powerful approach to multiple testing. J Roy Stat Soc Ser B 57: 289–300, 1995.
-
- Brailoiu E, Dun SL, Brailoiu GC, Mizuo K, Sklar LA, Oprea TI, Prossnitz ER, Dun NJ. Distribution and characterization of estrogen receptor G protein-coupled receptor 30 in the rat central nervous system. J Endocrinol 193: 311–321, 2007. - PubMed
-
- Bruce-Keller AJ, Keeling JL, Keller JN, Huang FF, Camondola S, Mattson MP. Antiinflammatory effects of estrogen on microglial activation. Endocrinology 141: 3646–3656, 2000. - PubMed
-
- Carnegie JA, Robertson HA. Conjugated and unconjugated estrogens in fetal and maternal fluids of the pregnant ewe: a possible role for estrone sulfate during early pregnancy. Biol Reprod 19: 202–211, 1978. - PubMed
-
- Cline MS, Smoot M, Cerami E, Kuchinsky A, Landys N, Workman C, Christmas R, Vila-Campilo I, Creech M, Gross B, Hanspers K, Isserlin R, Kelley R, Killcoyne S, Lotia S, Maere S, Morris J, Ono K, Pavlovic V, Pico AR, Vailaya A, Wang PL, Adler A, Conklin BR, Hood L, Kuiper M, Sander C, Schmulevich I, Schwikowski B, Warner GJ, Ideker T, Bader GD. Integration of biological networks and gene expression data using Cytoscape. Nat Protoc 2: 2366–2382, 2007. - PMC - PubMed
Publication types
MeSH terms
Substances
Grants and funding
LinkOut - more resources
Full Text Sources
Other Literature Sources
Molecular Biology Databases