

Chronic upper airway obstruction induces abnormal sleep/wake dynamics in juvenile rats
- PMID: 24824340
- PMCID: PMC4019644
- DOI: 10.1371/journal.pone.0097111
Chronic upper airway obstruction induces abnormal sleep/wake dynamics in juvenile rats
Abstract
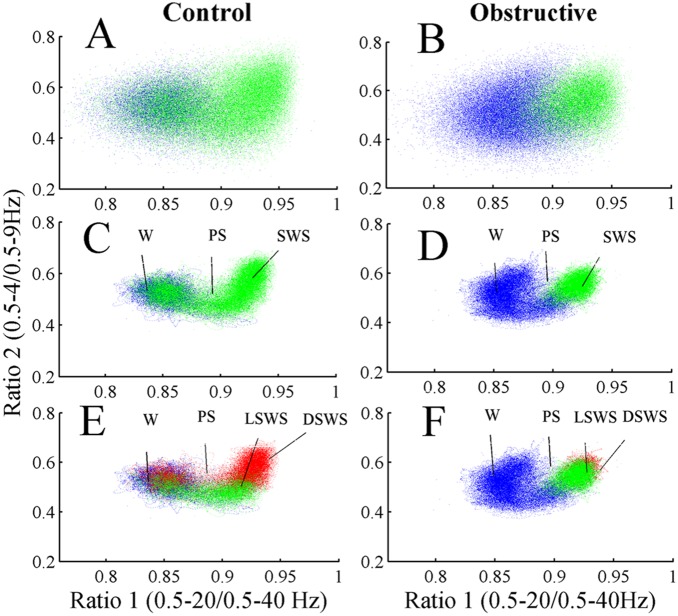
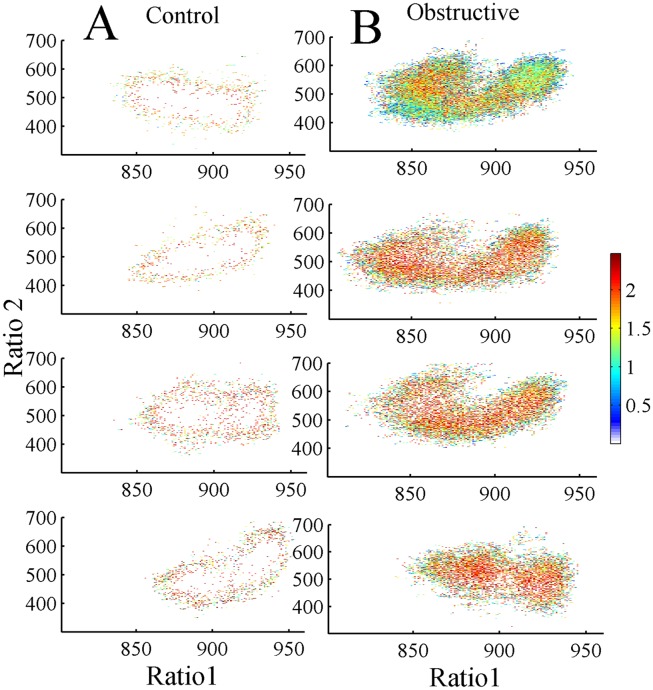
Objectives: Conventional scoring of sleep provides little information about the process of transitioning between vigilance-states. We used the state space technique to explore whether rats with chronic upper airway obstruction (UAO) have abnormal sleep/wake states, faster movements between states, or abnormal transitions between states.
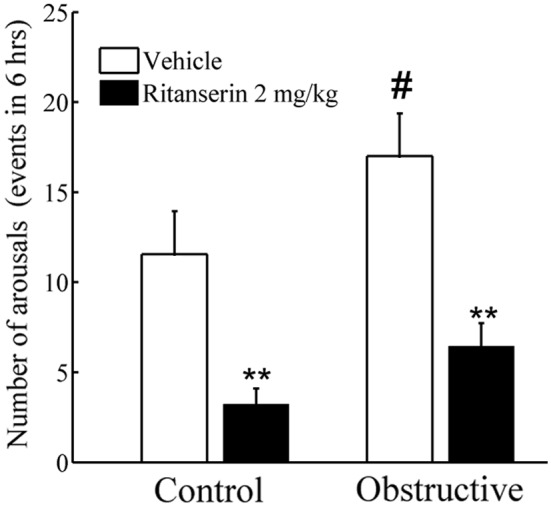
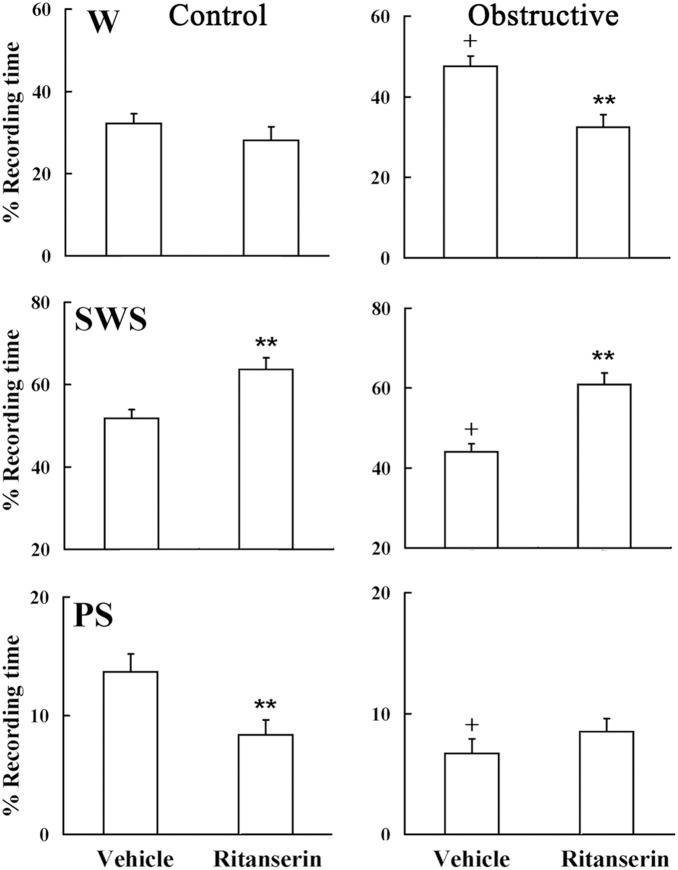
Design: The tracheae of 22-day-old Sprague-Dawley rats were surgically narrowed to increase upper airway resistance with no evidence for frank obstructed apneas or hypopneas; 24-h electroencephalography of sleep/wake recordings of UAO and sham-control animals was analyzed using state space technique. This non-categorical approach allows quantitative and unbiased examination of vigilance-states and state transitions. Measurements were performed 2 weeks post-surgery at baseline and following administration of ritanserin (5-HT2 receptor antagonist) the next day to stimulate sleep.
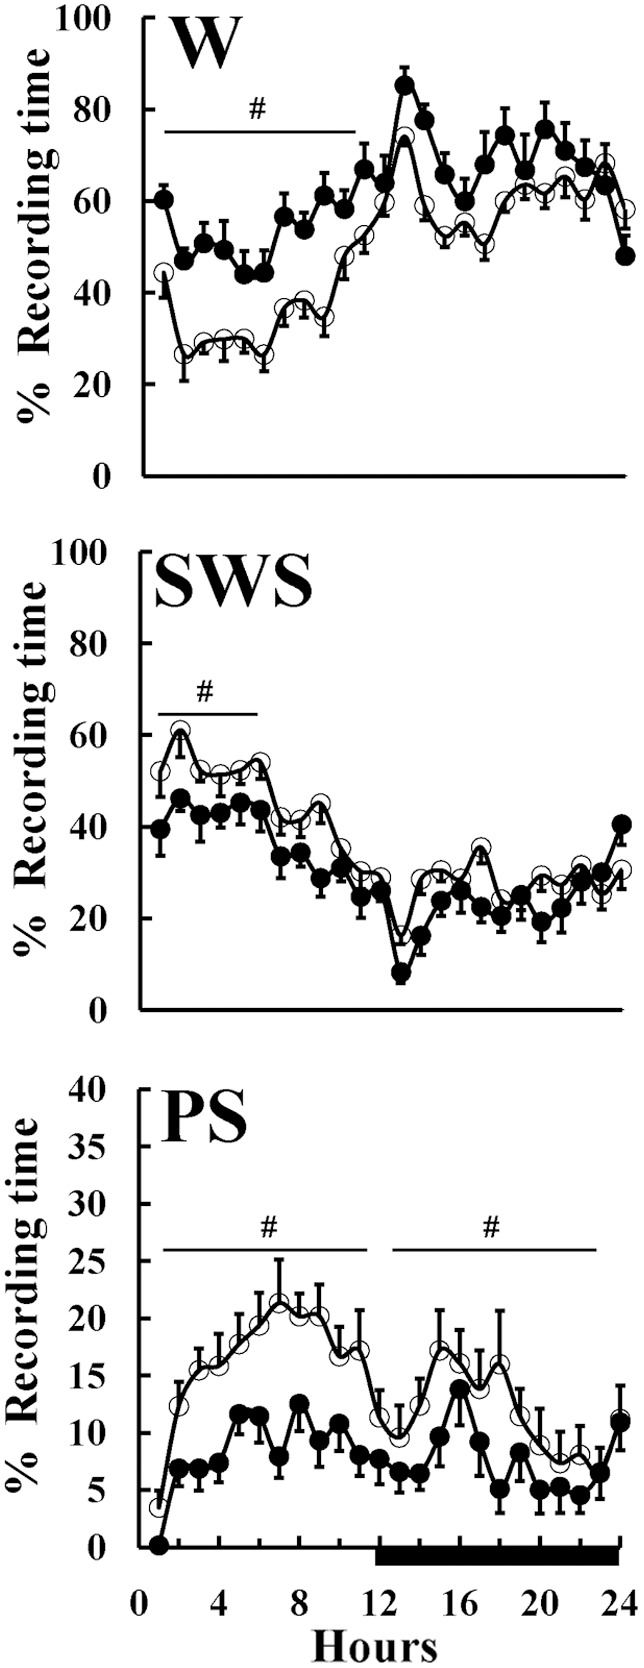
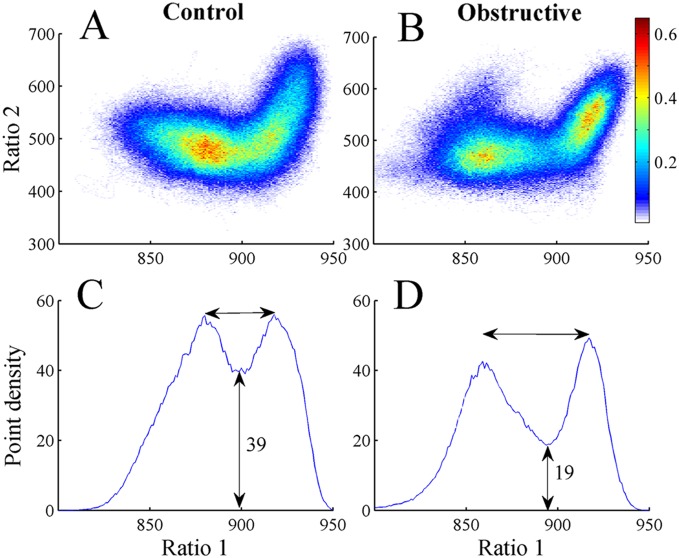
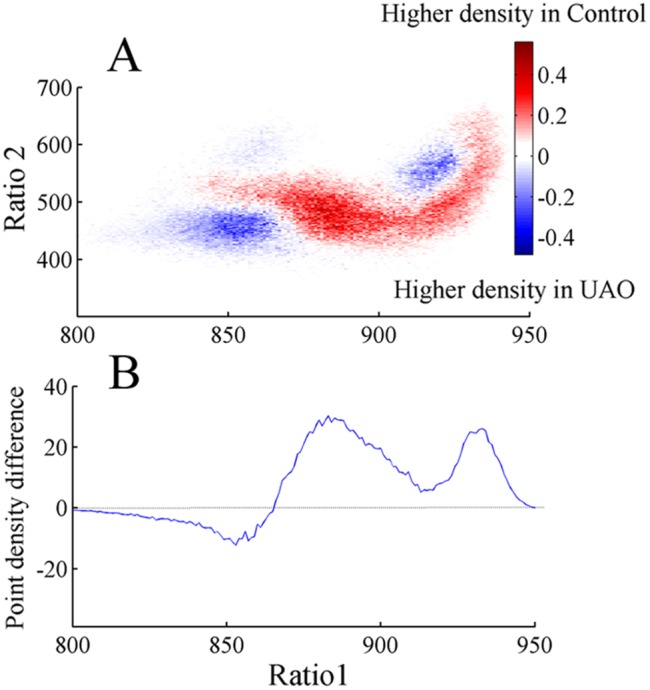
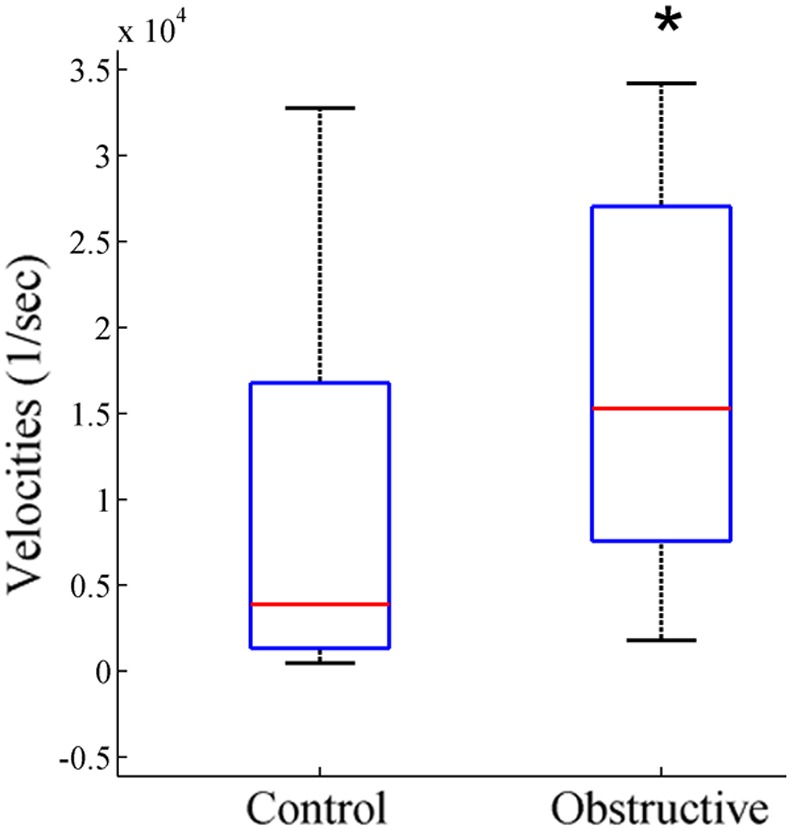
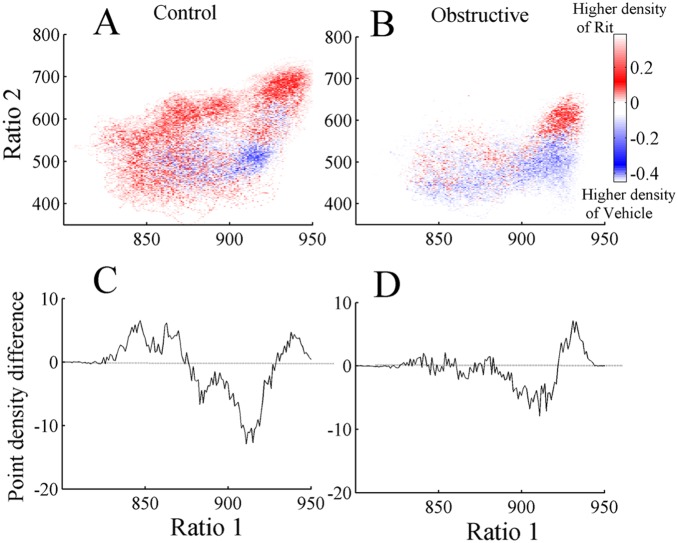
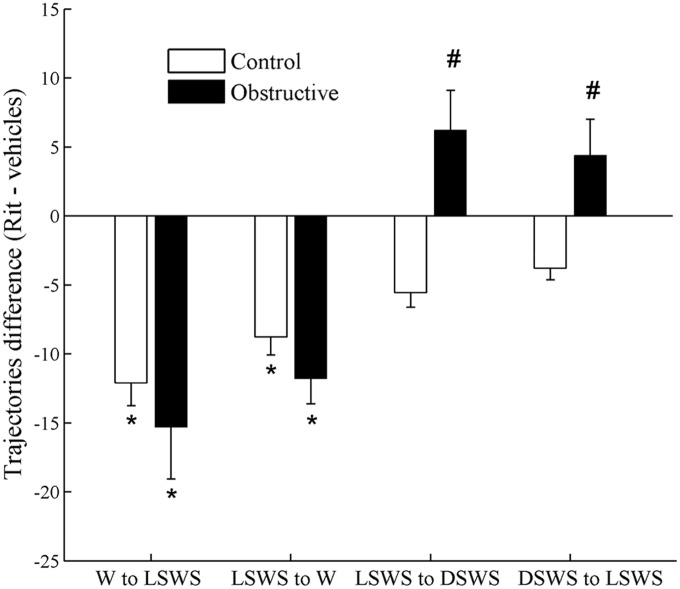
Measurements and results: UAO rats spent less time in deep (delta-rich) slow wave sleep (SWS) and near transition zones between states. State transitions from light SWS to wake and vice versa and microarousals were more frequent and rapid in UAO rats, indicating that obstructed animals have more regions where vigilance-states are unstable. Ritanserin consolidated sleep in both groups by decreasing the number of microarousals and trajectories between wake and light SWS, and increasing deep SWS in UAO.
Conclusions: State space technique enables visualization of vigilance-state transitions and velocities that were not evident by traditional scoring methods. This analysis provides new quantitative assessment of abnormal vigilance-state dynamics in UAO in the absence of frank obstructed apneas or hypopneas.
Conflict of interest statement
Figures
Similar articles
-
Sleep/Wake Dynamics Changes during Maturation in Rats.PLoS One. 2015 Apr 20;10(4):e0125509. doi: 10.1371/journal.pone.0125509. eCollection 2015. PLoS One. 2015. PMID: 25894573 Free PMC article.
-
Role of growth hormone-releasing hormone in sleep and growth impairments induced by upper airway obstruction in rats.Eur Respir J. 2011 Oct;38(4):870-7. doi: 10.1183/09031936.00197610. Epub 2011 Mar 15. Eur Respir J. 2011. PMID: 21406516
-
Abnormal sleep/wake dynamics in orexin knockout mice.Sleep. 2010 Mar;33(3):297-306. doi: 10.1093/sleep/33.3.297. Sleep. 2010. PMID: 20337187 Free PMC article.
-
Objective measurements for upper airway obstruction in infants with Robin sequence: what are we measuring? A systematic review.J Clin Sleep Med. 2021 Aug 1;17(8):1717-1729. doi: 10.5664/jcsm.9394. J Clin Sleep Med. 2021. PMID: 33960296 Free PMC article.
-
Serotonin control of sleep-wake behavior.Sleep Med Rev. 2011 Aug;15(4):269-81. doi: 10.1016/j.smrv.2010.11.003. Epub 2011 Apr 2. Sleep Med Rev. 2011. PMID: 21459634 Review.
Cited by
-
Abnormal Growth and Feeding Behavior in Upper Airway Obstruction in Rats.Front Endocrinol (Lausanne). 2018 Jun 4;9:298. doi: 10.3389/fendo.2018.00298. eCollection 2018. Front Endocrinol (Lausanne). 2018. PMID: 29915561 Free PMC article. Review.
-
Sleep/wake movement velocities, trajectories and micro-arousals during maturation in rats.BMC Neurosci. 2017 Feb 7;18(1):24. doi: 10.1186/s12868-017-0343-6. BMC Neurosci. 2017. PMID: 28173758 Free PMC article.
-
Orexin Plays a Role in Growth Impediment Induced by Obstructive Sleep Breathing in Rats.Sleep. 2016 Apr 1;39(4):887-97. doi: 10.5665/sleep.5648. Sleep. 2016. PMID: 26943473 Free PMC article.
-
Abnormal Growth and Feeding Behavior Persist After Removal of Upper Airway Obstruction in Juvenile Rats.Sci Rep. 2017 Jun 2;7(1):2730. doi: 10.1038/s41598-017-02843-5. Sci Rep. 2017. PMID: 28577340 Free PMC article.
-
Sleep/Wake Dynamics Changes during Maturation in Rats.PLoS One. 2015 Apr 20;10(4):e0125509. doi: 10.1371/journal.pone.0125509. eCollection 2015. PLoS One. 2015. PMID: 25894573 Free PMC article.
References
-
- Marcus CL, Brooks LJ, Draper KA, Gozal D, Halbower AC, et al. (2012. American Academy of Pediatrics. Diagnosis and management of childhood obstructive sleep apnea syndrome. Pediatrics 130: e714–55. - PubMed
-
- Bar A, Tarasiuk A, Segev Y, Phillip M, Tal A (1999) The effect of adenotonsillectomy on serum insulin-like growth factor-I and growth in children with UAO sleep apnea syndrome. J Pediatr 135: 76–80. - PubMed
-
- Bonuck KA, Freeman K, Henderson J (2009) Growth and growth biomarker changes after adenotonsillectomy: systematic review and meta-analysis. Arch Dis Child 94: 83–91. - PubMed
-
- Marcus CL, Carroll JL, Koerner CB, Hamer A, Lutz J, et al. (1994) Determinants of growth in children with the UAO sleep apnea syndrome. J Pediatr 125: 556–62. - PubMed
Publication types
MeSH terms
Substances
LinkOut - more resources
Full Text Sources
Other Literature Sources
