

A data-driven, mathematical model of mammalian cell cycle regulation
- PMID: 24824602
- PMCID: PMC4019653
- DOI: 10.1371/journal.pone.0097130
A data-driven, mathematical model of mammalian cell cycle regulation
Abstract
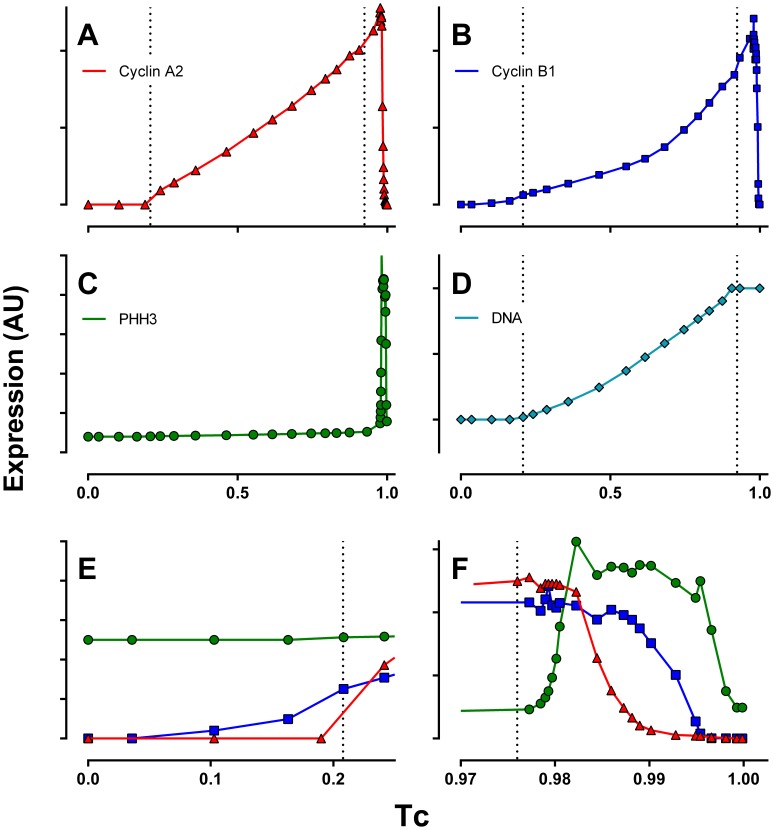
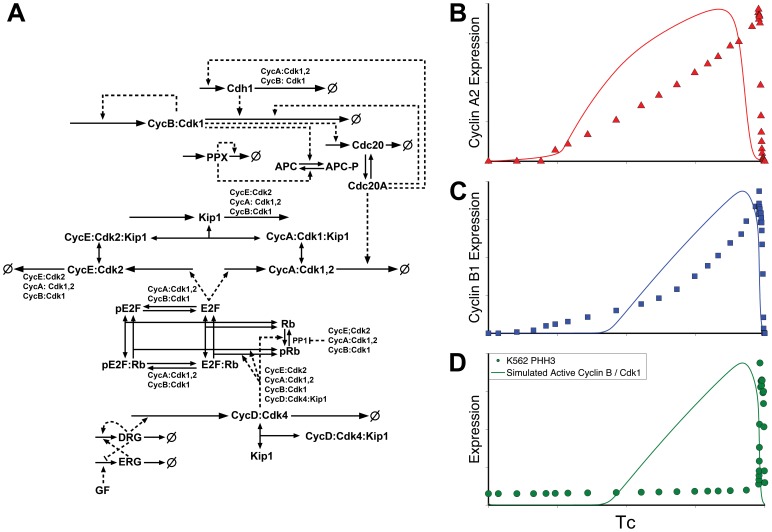
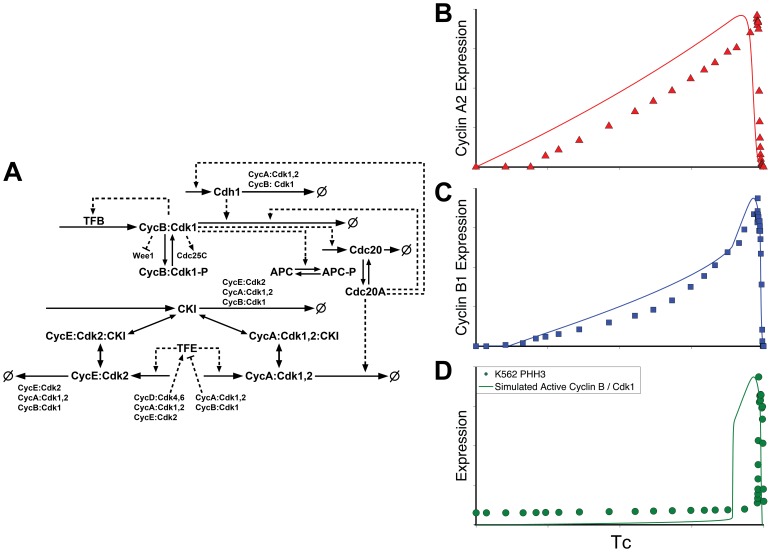
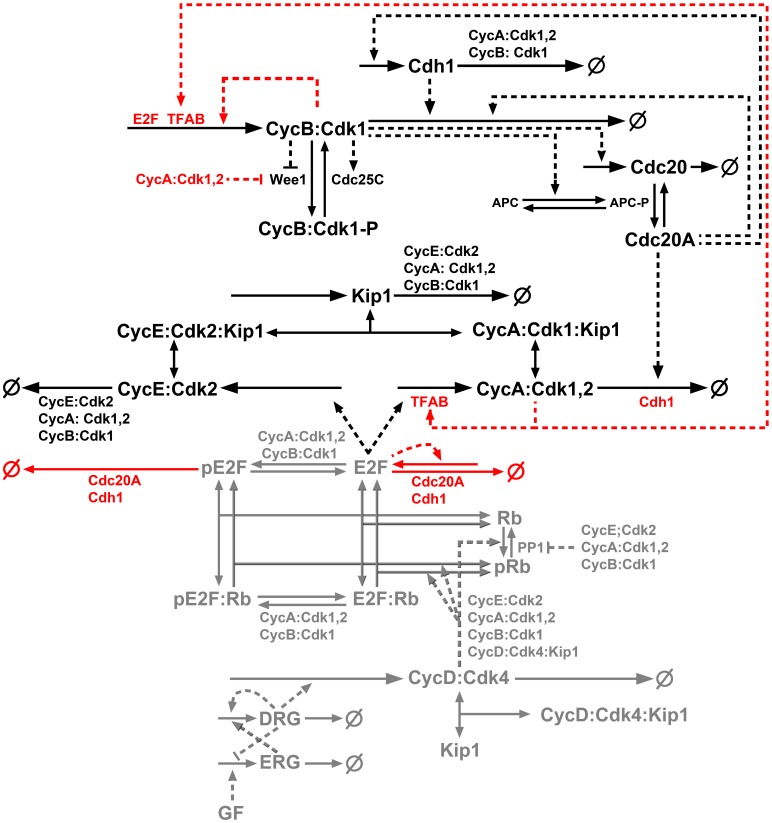
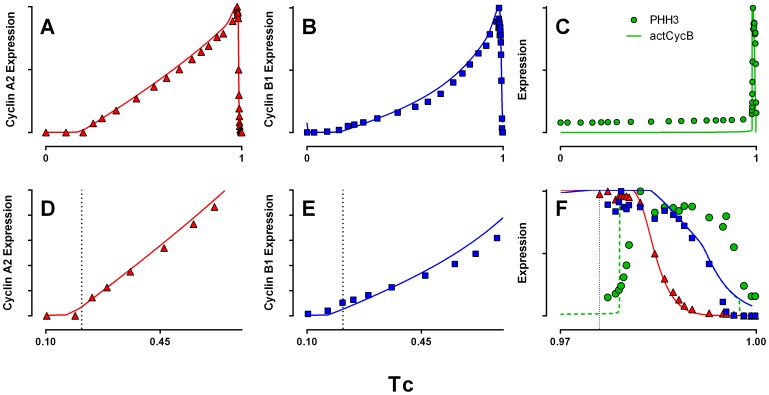
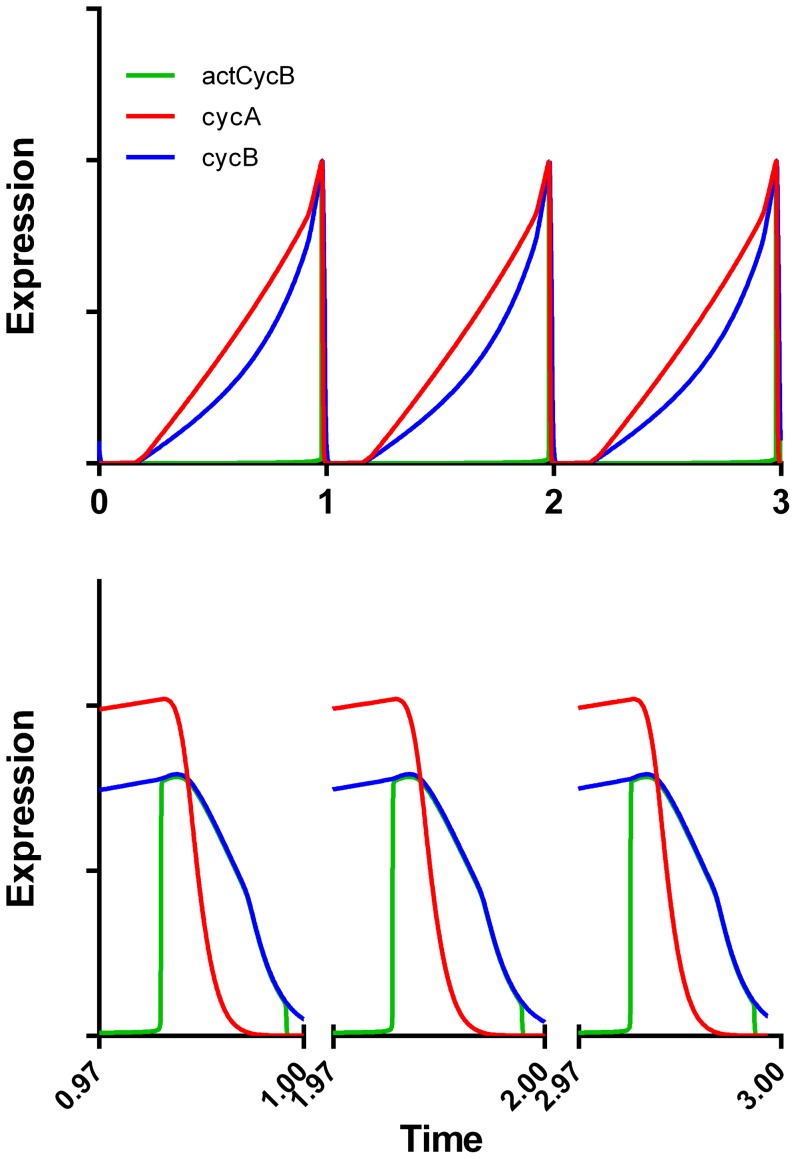
Few of >150 published cell cycle modeling efforts use significant levels of data for tuning and validation. This reflects the difficultly to generate correlated quantitative data, and it points out a critical uncertainty in modeling efforts. To develop a data-driven model of cell cycle regulation, we used contiguous, dynamic measurements over two time scales (minutes and hours) calculated from static multiparametric cytometry data. The approach provided expression profiles of cyclin A2, cyclin B1, and phospho-S10-histone H3. The model was built by integrating and modifying two previously published models such that the model outputs for cyclins A and B fit cyclin expression measurements and the activation of B cyclin/Cdk1 coincided with phosphorylation of histone H3. The model depends on Cdh1-regulated cyclin degradation during G1, regulation of B cyclin/Cdk1 activity by cyclin A/Cdk via Wee1, and transcriptional control of the mitotic cyclins that reflects some of the current literature. We introduced autocatalytic transcription of E2F, E2F regulated transcription of cyclin B, Cdc20/Cdh1 mediated E2F degradation, enhanced transcription of mitotic cyclins during late S/early G2 phase, and the sustained synthesis of cyclin B during mitosis. These features produced a model with good correlation between state variable output and real measurements. Since the method of data generation is extensible, this model can be continually modified based on new correlated, quantitative data.
Conflict of interest statement
Figures
Similar articles
-
[Molecular mechanisms controlling the cell cycle: fundamental aspects and implications for oncology].Cancer Radiother. 2001 Apr;5(2):109-29. doi: 10.1016/s1278-3218(01)00087-7. Cancer Radiother. 2001. PMID: 11355576 Review. French.
-
From simple to complex patterns of oscillatory behavior in a model for the mammalian cell cycle containing multiple oscillatory circuits.Chaos. 2010 Dec;20(4):045109. doi: 10.1063/1.3527998. Chaos. 2010. PMID: 21198121
-
Accumulation of cyclin B1 requires E2F and cyclin-A-dependent rearrangement of the anaphase-promoting complex.Nature. 1999 Oct 21;401(6755):815-8. doi: 10.1038/44611. Nature. 1999. PMID: 10548110
-
Deubiquitinase USP37 is activated by CDK2 to antagonize APC(CDH1) and promote S phase entry.Mol Cell. 2011 May 20;42(4):511-23. doi: 10.1016/j.molcel.2011.03.027. Mol Cell. 2011. PMID: 21596315
-
Cyclin/Cdk complexes: their involvement in cell cycle progression and mitotic division.Protoplasma. 2001;216(3-4):119-42. doi: 10.1007/BF02673865. Protoplasma. 2001. PMID: 11732181 Review.
Cited by
-
Reusable rule-based cell cycle model explains compartment-resolved dynamics of 16 observables in RPE-1 cells.PLoS Comput Biol. 2024 Jan 8;20(1):e1011151. doi: 10.1371/journal.pcbi.1011151. eCollection 2024 Jan. PLoS Comput Biol. 2024. PMID: 38190398 Free PMC article.
-
Cell cycle proliferation decisions: the impact of single cell analyses.FEBS J. 2017 Feb;284(3):362-375. doi: 10.1111/febs.13898. Epub 2016 Oct 5. FEBS J. 2017. PMID: 27634578 Free PMC article. Review.
-
Dynamic Modeling of Cell Cycle Arrest Through Integrated Single-Cell and Mathematical Modelling Approaches.bioRxiv [Preprint]. 2025 Feb 26:2025.02.20.639240. doi: 10.1101/2025.02.20.639240. bioRxiv. 2025. PMID: 40060624 Free PMC article. Preprint.
-
Deoxyribonucleic Acid Damage and Repair: Capitalizing on Our Understanding of the Mechanisms of Maintaining Genomic Integrity for Therapeutic Purposes.Int J Mol Sci. 2018 Apr 11;19(4):1148. doi: 10.3390/ijms19041148. Int J Mol Sci. 2018. PMID: 29641431 Free PMC article. Review.
-
A mathematical model of subpopulation kinetics for the deconvolution of leukaemia heterogeneity.J R Soc Interface. 2015 Jul 6;12(108):20150276. doi: 10.1098/rsif.2015.0276. J R Soc Interface. 2015. PMID: 26040591 Free PMC article.
References
Publication types
MeSH terms
Substances
Grants and funding
LinkOut - more resources
Full Text Sources
Other Literature Sources
Miscellaneous
