

doi: 10.1038/ismej.2014.76.
Epub 2014 May 13.
Estimating coverage in metagenomic data sets and why it matters
Affiliations
- PMID: 24824669
- PMCID: PMC4992084
- DOI: 10.1038/ismej.2014.76
Item in Clipboard
Estimating coverage in metagenomic data sets and why it matters
ISME J.
2014 Nov.
No abstract available
Figures
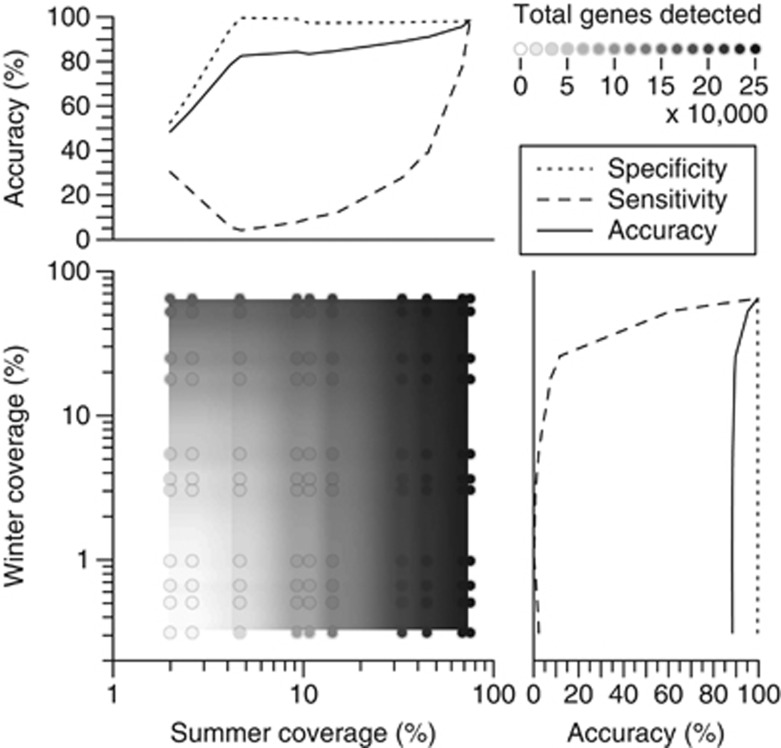
Effect of average coverage on detection of differentially abundant features. The abundance of nonredundant genes (assembled and clustered at 98% amino-acid identity) detected in the metagenomes of Lake Lanier (Atlanta, GA, USA; Sequence Read Archive Projects SRP028408, SRP005437-9; abundance estimates were based on read-mapping at 95% nucleotide identity) was compared between three summer and two winter samples, at different levels of subsampling (0.01–50% of the total data set) and the coverage was computed using Nonpareil (coverage axes). The main panel (bottom-left) shows the number of detected genes, represented by the color of the circles (see legend). The values between subsamples were estimated using bicubic interpolation. Note that the detection of genes is more strongly affected by the coverage in summer data sets owing to lower gene richness in the winter data sets. The additional panels correspond to the comparisons of the subsamples against the complete (not subsampled) data sets, which showed 64% and 75% coverage for winter and summer, respectively. The comparison between complete winter and summer data sets (top-right circle in main panel) was used as a reference for the definition of true/false positives (TP/FP) and true/false negatives (TN/FN). Sensitivity was defined as TP/(TP+FN), specificity as TN/(FP+TN) and accuracy of the test as (TP+TN)/(TP+TN+FN+FN). Sensitivity, specificity and accuracy were interpolated using cubic splines with smoothing parameter 0.6. Differential abundance was defined as adjusted P-value ⩽0.1 in the negative binomial test implemented in DESeq (Anders and Huber, 2010). Note that sensitivity drops rapidly when coverage of any (or both) of the collections of data sets decreases, while specificity is typically high, except at extreme differences in coverage. In general, the accuracy was compromised (<90%) in data sets with >twofold difference of coverage.
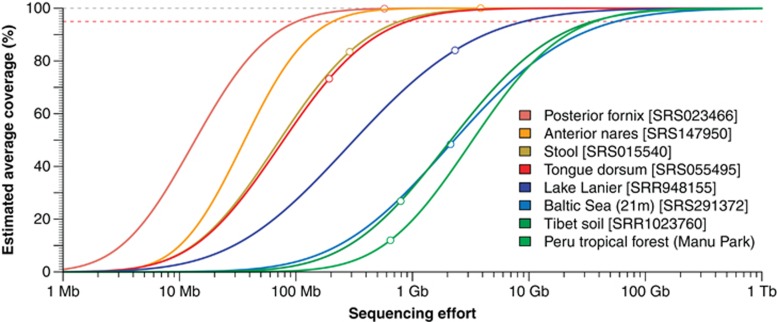
Comparison of diversity and coverage in available metagenomic data sets using Nonpareil curves. The abundance-weighted average coverage is presented as a function of sequencing effort in the form of Nonpareil curves (Rodriguez-R and Konstantinidis, 2013) for selected available metagenomic data sets. Note that more diverse communities require larger sequencing efforts to achieve the same level of coverage, hence located rightward in the plot. Four samples of the Human Microbiome Project are shown that represent communities in the human microbiome of varying diversity, all of which are less diverse than selected environmental samples. Soil (Tibet soil and Peru tropical forest) and marine (Baltic sea, 21 m depth) samples are the most diverse among those selected. The Sequence Read Archive identifier of each sample is provided within squared brackets, except for the Peru tropical forest sample obtained from Fierer et al. (2012).
References
-
- Caro-Quintero A, Konstantinidis KT. (2012). Bacterial species may exist, metagenomics reveal. Environ Microbiol 14: 347–355. - PubMed
Publication types
MeSH terms
LinkOut - more resources
Full Text Sources
Other Literature Sources
