

Expression profiling of differentiating eosinophils in bone marrow cultures predicts functional links between microRNAs and their target mRNAs
- PMID: 24824797
- PMCID: PMC4019607
- DOI: 10.1371/journal.pone.0097537
Expression profiling of differentiating eosinophils in bone marrow cultures predicts functional links between microRNAs and their target mRNAs
Abstract
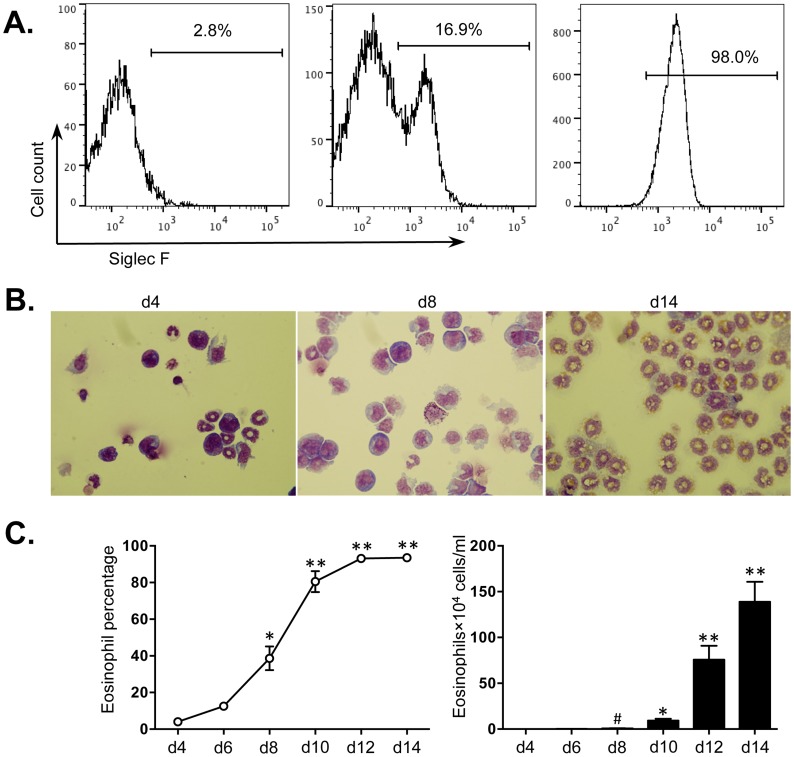
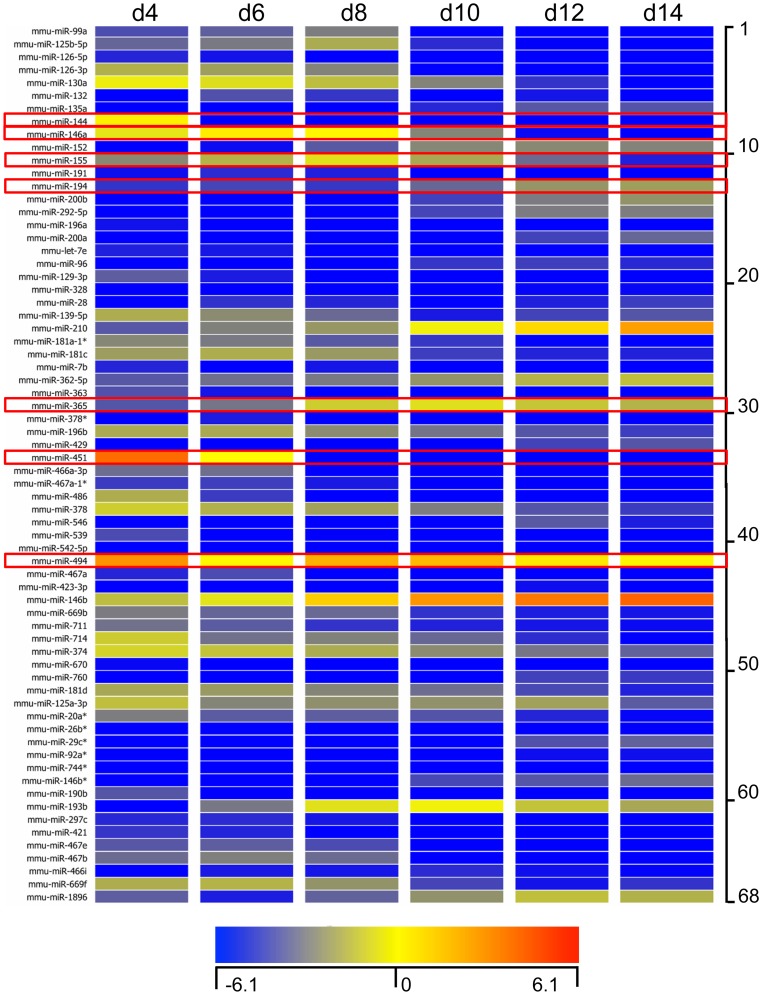
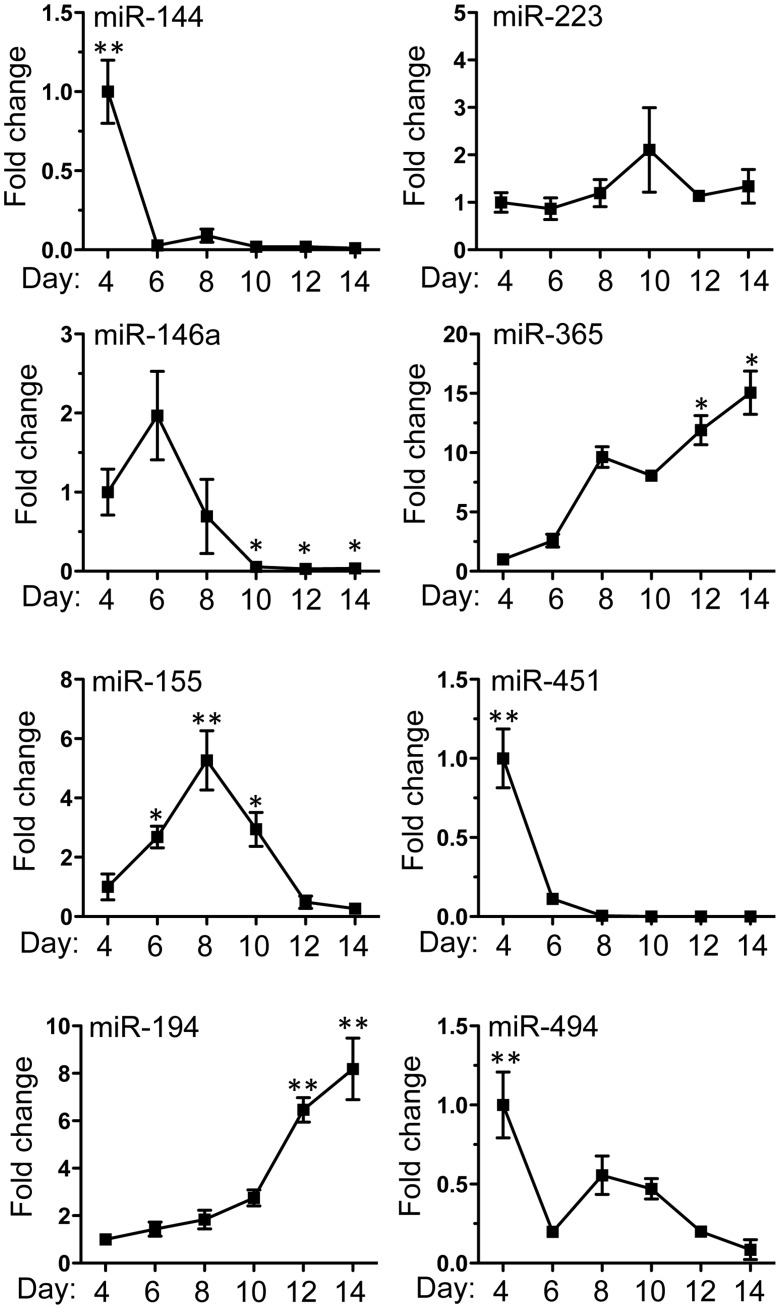
Background: MicroRNAs (miRNAs) are small non-coding RNAs that regulate complex transcriptional networks underpin immune responses. However, little is known about the specific miRNA networks that control differentiation of specific leukocyte subsets. In this study, we profiled miRNA expression during differentiation of eosinophils from bone marrow (BM) progenitors (bmEos), and correlated expression with potential mRNA targets involved in crucial regulatory functions. Profiling was performed on whole BM cultures to document the dynamic changes in miRNA expression in the BM microenvironment over the differentiation period. miRNA for network analysis were identified in BM cultures enriched in differentiating eosinophils, and chosen for their potential ability to target mRNA of factors that are known to play critical roles in eosinophil differentiation pathways or cell identify.
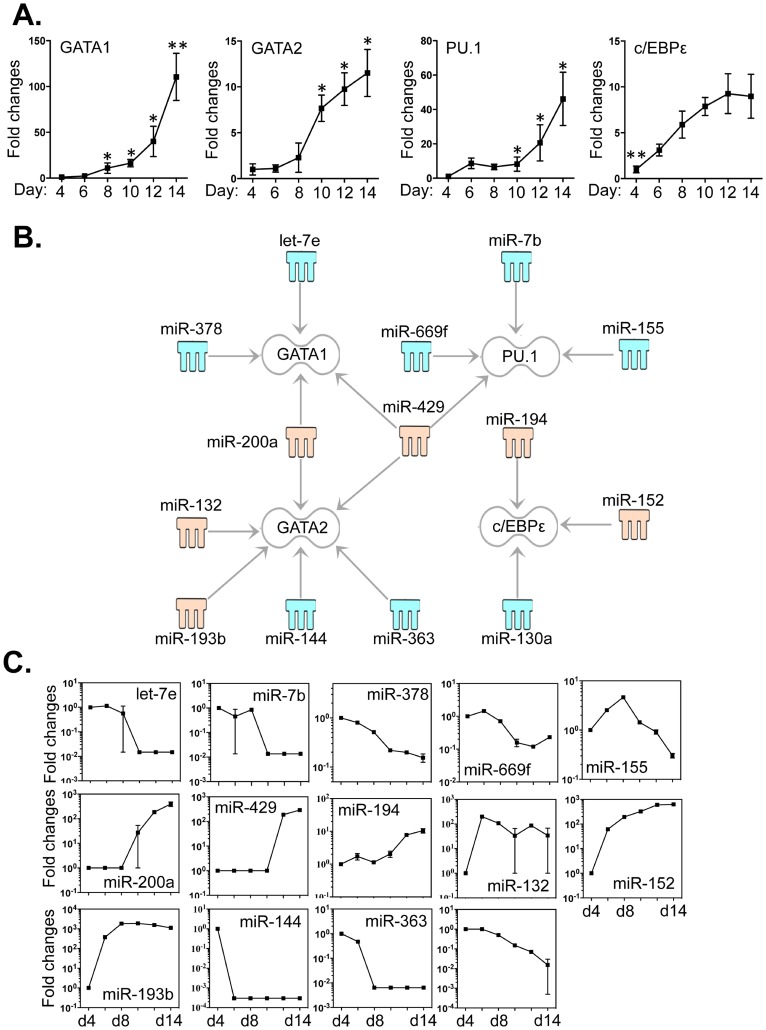
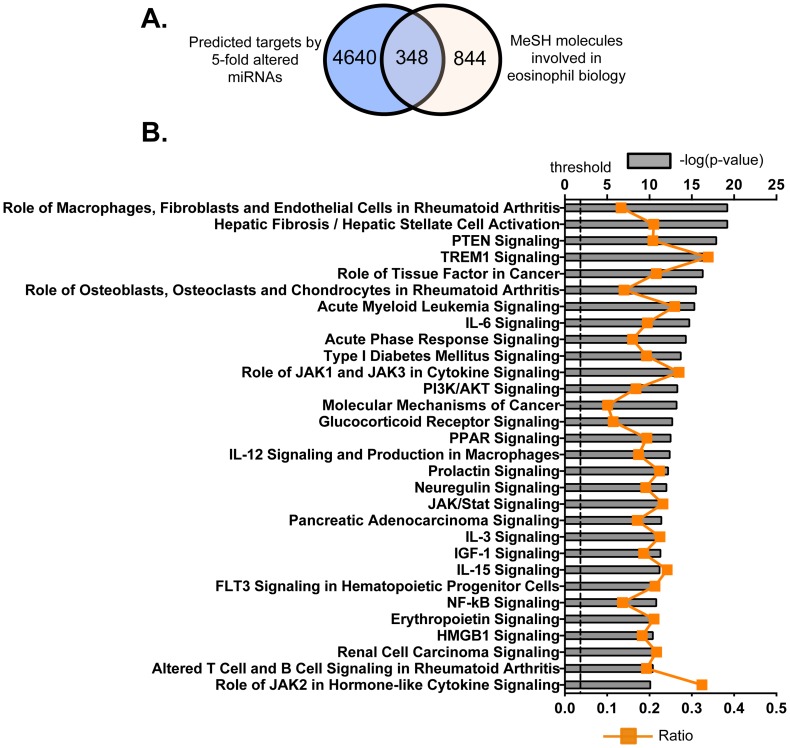
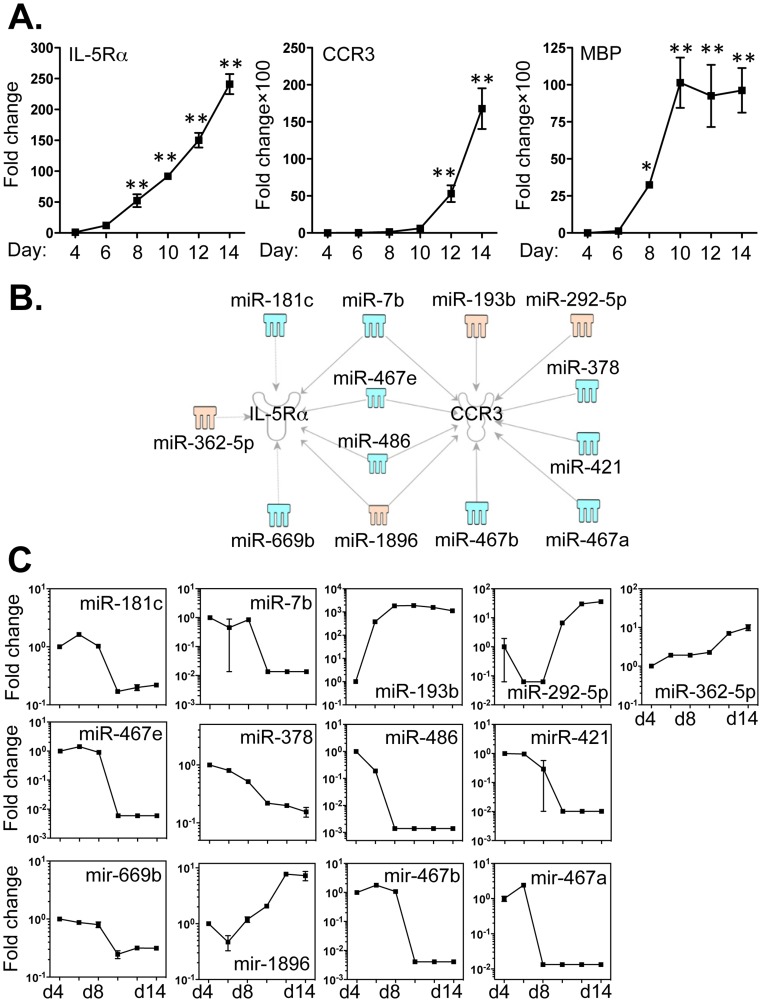
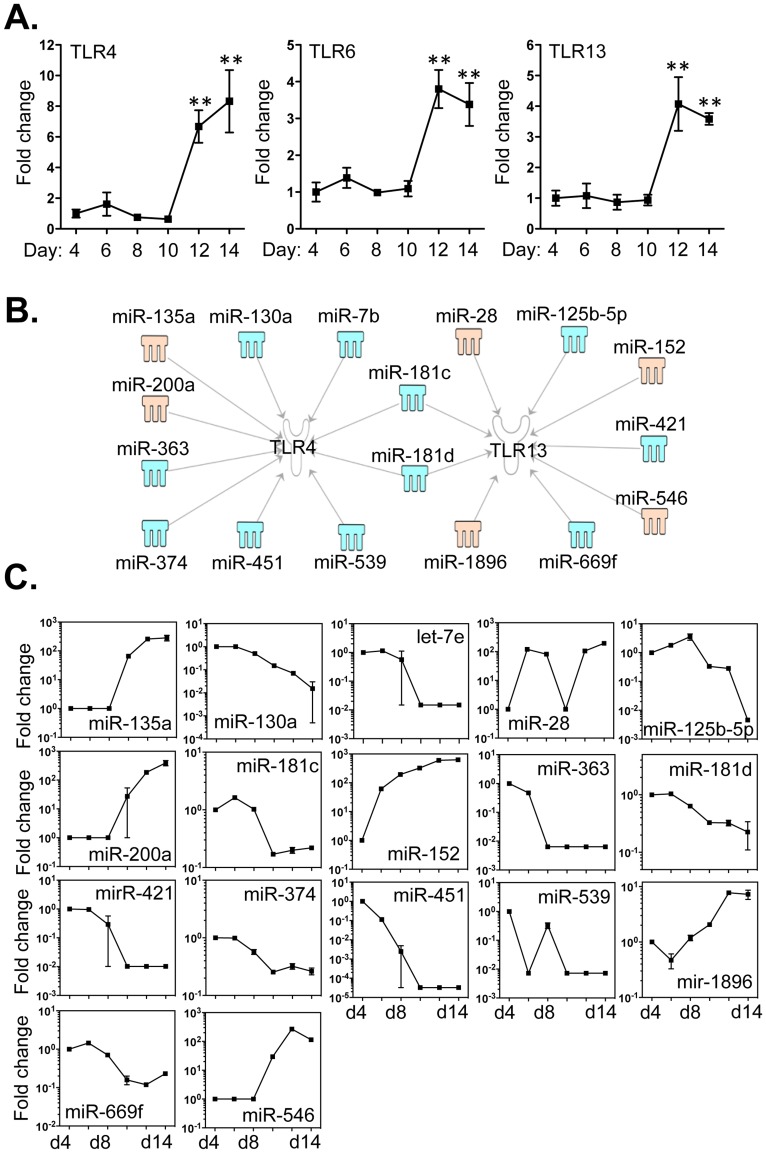
Methodology/principal findings: We identified 68 miRNAs with expression patterns that were up- or down- regulated 5-fold or more during bmEos differentiation. By employing TargetScan and MeSH databases, we identified 348 transcripts involved in 30 canonical pathways as potentially regulated by these miRNAs. Furthermore, by applying miRanda and Ingenuity Pathways Analysis (IPA), we identified 13 specific miRNAs that are temporally associated with the expression of IL-5Rα and CCR3 and 14 miRNAs associated with the transcription factors GATA-1/2, PU.1 and C/EBPε. We have also identified 17 miRNAs that may regulate the expression of TLRs 4 and 13 during eosinophil differentiation, although we could identify no miRNAs targeting the prominent secretory effector, eosinophil major basic protein.
Conclusions/significance: This is the first study to map changes in miRNA expression in whole BM cultures during the differentiation of eosinophils, and to predict functional links between miRNAs and their target mRNAs for the regulation of eosinophilopoiesis. Our findings provide an important resource that will promote the platform for further understanding of the role of these non-coding RNAs in the regulation of eosinophil differentiation and function.
Conflict of interest statement
Figures
Similar articles
-
Identification of the microRNA networks contributing to macrophage differentiation and function.Oncotarget. 2016 May 17;7(20):28806-20. doi: 10.18632/oncotarget.8933. Oncotarget. 2016. PMID: 27119502 Free PMC article.
-
Identification of microRNAs regulating the developmental pathways of bone marrow derived mast cells.PLoS One. 2014 May 21;9(5):e98139. doi: 10.1371/journal.pone.0098139. eCollection 2014. PLoS One. 2014. PMID: 24848502 Free PMC article.
-
Differential expression of basal microRNAs' patterns in human dental pulp stem cells.J Cell Mol Med. 2015 Mar;19(3):566-80. doi: 10.1111/jcmm.12381. Epub 2014 Dec 5. J Cell Mol Med. 2015. PMID: 25475098 Free PMC article.
-
Regulation of the MIR155 host gene in physiological and pathological processes.Gene. 2013 Dec 10;532(1):1-12. doi: 10.1016/j.gene.2012.12.009. Epub 2012 Dec 14. Gene. 2013. PMID: 23246696 Review.
-
Embryonic stem cell microRNAs: defining factors in induced pluripotent (iPS) and cancer (CSC) stem cells?Curr Stem Cell Res Ther. 2009 Sep;4(3):168-77. doi: 10.2174/157488809789057400. Curr Stem Cell Res Ther. 2009. PMID: 19492978 Review.
Cited by
-
MicroRNA-26a/-26b-COX-2-MIP-2 Loop Regulates Allergic Inflammation and Allergic Inflammation-promoted Enhanced Tumorigenic and Metastatic Potential of Cancer Cells.J Biol Chem. 2015 May 29;290(22):14245-66. doi: 10.1074/jbc.M115.645580. Epub 2015 Apr 23. J Biol Chem. 2015. PMID: 25907560 Free PMC article.
-
MicroRNA regulation of allergic inflammation and asthma.Curr Opin Immunol. 2015 Oct;36:101-8. doi: 10.1016/j.coi.2015.07.006. Epub 2015 Aug 5. Curr Opin Immunol. 2015. PMID: 26253882 Free PMC article. Review.
-
Advancing toward a unified eosinophil signature from transcriptional profiling.J Leukoc Biol. 2024 Nov 27;116(6):1324-1333. doi: 10.1093/jleuko/qiae188. J Leukoc Biol. 2024. PMID: 39213186 Review.
-
MicroRNA-185 regulates expression of lipid metabolism genes and improves insulin sensitivity in mice with non-alcoholic fatty liver disease.World J Gastroenterol. 2014 Dec 21;20(47):17914-23. doi: 10.3748/wjg.v20.i47.17914. World J Gastroenterol. 2014. PMID: 25548489 Free PMC article.
-
Identification of the microRNA networks contributing to macrophage differentiation and function.Oncotarget. 2016 May 17;7(20):28806-20. doi: 10.18632/oncotarget.8933. Oncotarget. 2016. PMID: 27119502 Free PMC article.
References
Publication types
MeSH terms
Substances
LinkOut - more resources
Full Text Sources
Other Literature Sources
