. 2014 Aug 1;140(2):338-51.
doi: 10.1093/toxsci/kfu089. Epub 2014 May 13.

Forecasting cell death dose-response from early signal transduction responses in vitro

Affiliations

Forecasting cell death dose-response from early signal transduction responses in vitro

Julie A Vrana et al. Toxicol Sci. .

Abstract

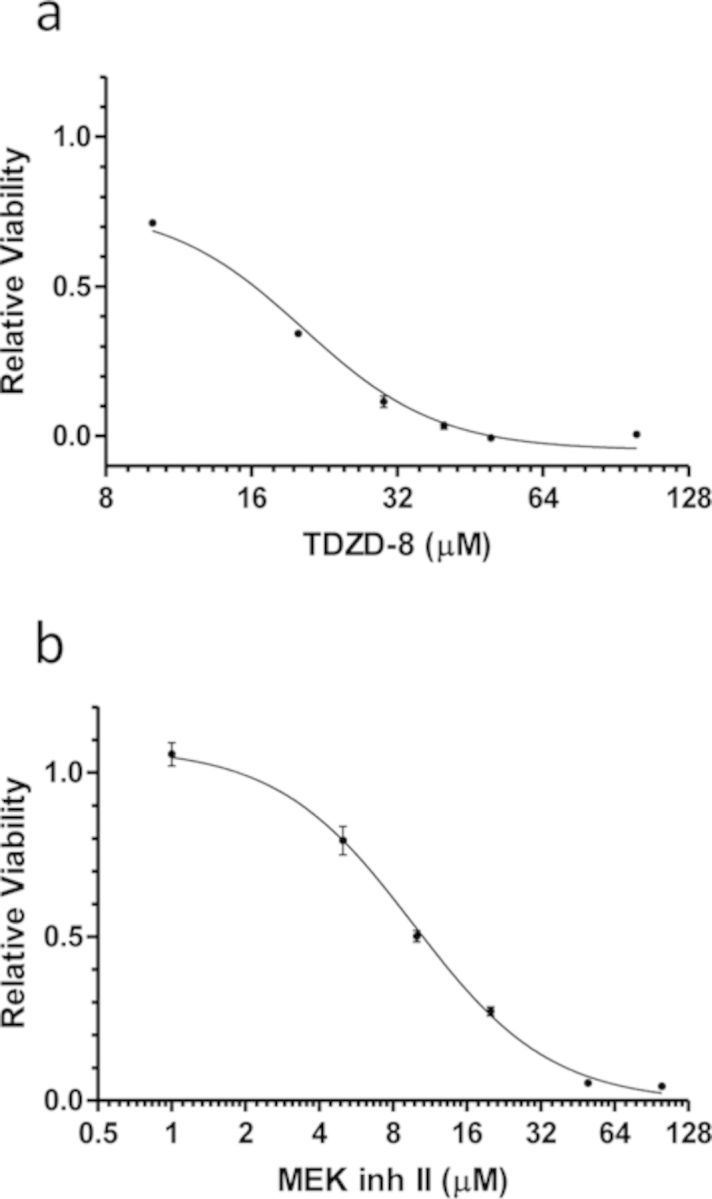
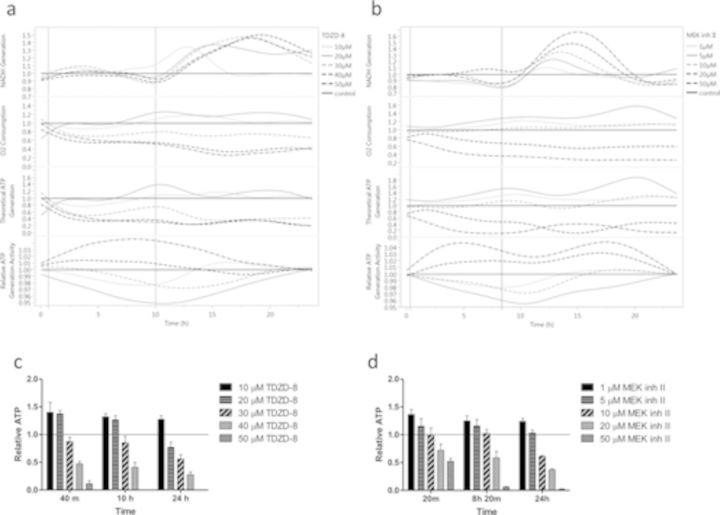
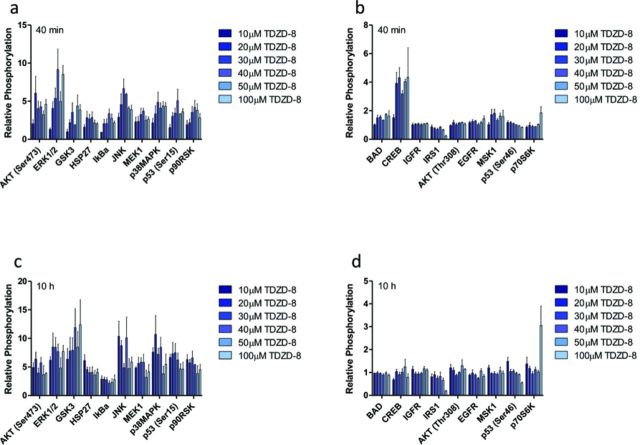
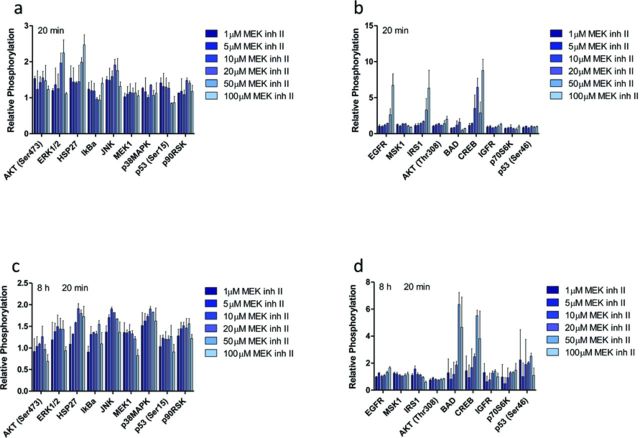
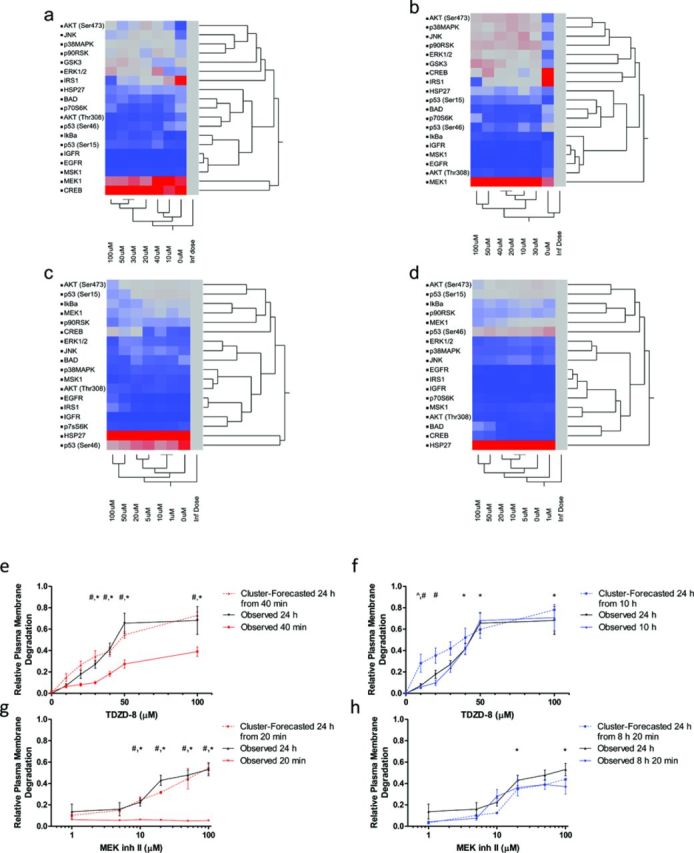
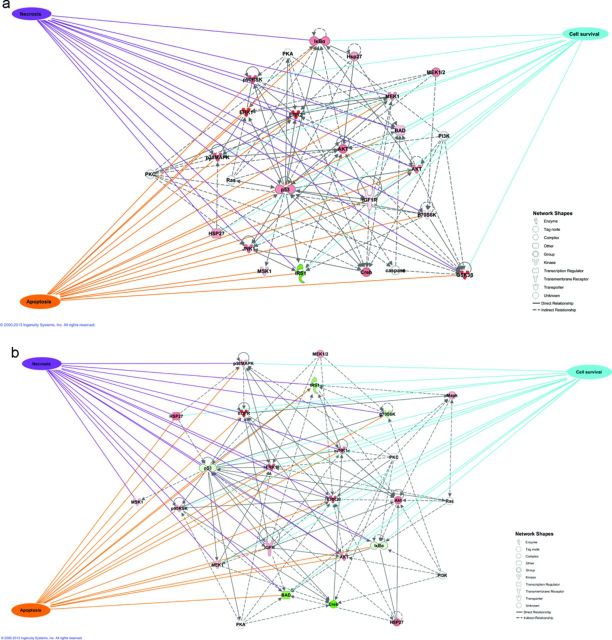
The rapid pharmacodynamic response of cells to toxic xenobiotics is primarily coordinated by signal transduction networks, which follow a simple framework: the phosphorylation/dephosphorylation cycle mediated by kinases and phosphatases. However, the time course from initial pharmacodynamic response(s) to cell death following exposure can have a vast range. Viewing this time lag between early signaling events and the ultimate cellular response as an opportunity, we hypothesize that monitoring the phosphorylation of proteins related to cell death and survival pathways at key, early time points may be used to forecast a cell's eventual fate, provided that we can measure and accurately interpret the protein responses. In this paper, we focused on a three-phased approach to forecast cell death after exposure: (1) determine time points relevant to important signaling events (protein phosphorylation) by using estimations of adenosine triphosphate production to reflect the relationship between mitochondrial-driven energy metabolism and kinase response, (2) experimentally determine phosphorylation values for proteins related to cell death and/or survival pathways at these significant time points, and (3) use cluster analysis to predict the dose-response relationship between cellular exposure to a xenobiotic and plasma membrane degradation at 24 h post-exposure. To test this approach, we exposed HepG2 cells to two disparate treatments: a GSK-3β inhibitor and a MEK inhibitor. After using our three-phased approach, we were able to accurately forecast the 24 h HepG2 plasma membrane degradation dose-response from protein phosphorylation values as early as 20 min post-MEK inhibitor exposure and 40 min post-GSK-3β exposure.

Keywords: cytotoxicity; dose-response; kinase; predictive toxicology; signal transduction.


Figures

FIG. 1.
FIG. 1.
HepG2 viability to determine relevant TDZD-8 and MEK inh II doses. HepG2 viability dose-response curves for (a) TDZD-8 and (b) MEK inh II. Viability was measured by MTT assay and is shown as relative viability. Relative viability was calculated relative to control cells, which received dosing vehicle (< 1% DMSO), but no inhibitor. Dose-response curves were generated using the best-fit Hill-plot regression with varying slope. The x-axis is shown as log2 to better visualize TDZD-8 and MEK inh II dosing range. Error bars reflect ± S.E.M.
FIG. 2.
FIG. 2.
Theoretical ATP generation and activity models indicate key bifurcation points for HepG2 cells exposed to TDZD-8 and MEK inh II. (a) Using the NADH/NADPH absorbance at 340 nm, NADH generation was measured every 10 min for 24 h following administration of 10, 20, 30, 40, and 50μM doses of TDZD-8 to HepG2 cells. Data are reported as relative NADH generation, which was normalized to controls that received vehicle control (< 1% DMSO). Oxygen consumption of HepG2 cells exposed to TDZD-8 was monitored every 10 min for 24 h with an oxygen sensitive probe (MitoXpress). An increase in probe signal indicates an increase in oxygen consumption relative to controls, which received dosing vehicle (< 1% DMSO). Theoretical ATP generation (third graph) was calculated using the “If then else loop,” as described in Results, which is based on the stoichiometric production of ATP from cellular respiration (oxidative phosphorylation). Relative ATP generation activity (fourth graph) was calculated from Equation 3. Critical signaling events were selected at 40 min and 10 h post-TDZD-8 exposure from our bifurcation analysis described in Results. (b) HepG2 cells exposed to 1, 5, 10, 20, and 50μM doses of MEK inh II were measured and analyzed in the same way as TDZD-8. Critical signaling events were selected at 20 min and 8 h 20 min post-MEK inh II exposure from our bifurcation analysis described in Results. To determine if the theoretical ATP generation model predicted relative cellular ATP levels, the luciferase assay was used to measure cellular ATP at the time points of interest. Extracted cellular ATP of HepG2 cells exposed to either (c) TDZD-8 or (d) MEK inh II were measured using the luciferase assay as described in Materials and Methods. Relative cellular ATP from the luciferase assay of TDZD-8 exposed cells (c) was found to be significantly correlated to our theoretical ATP generation (a, third graph) for TDZD-8 (r = 0.59, p = 0.021) at the time points of interest (40 min, 10 h, and 24 h). Relative cellular ATP from the luciferase assay of MEK inh II exposed cells (d) was found to be significantly correlated to the theoretical ATP generation for MEK inh II (b, third graph) for MEK inh II (r = 0.85, p < 0.001) at the time points of interest (20 min, 8 h 20 min, and 24 h). Results were reported as relative to controls, which received dosing vehicle (< 1% DMSO) and error bars reflect S.E.M.
FIG. 3.
FIG. 3.
Protein phosphorylation responses of HepG2 cells to TDZD-8. From the previously determined temporal bifurcations (40 min and 10 h), relative protein phosphorylation was determined by dosing HepG2 cells with various doses of TDZD-8 (10, 20, 30, 40, 50, and 100μM) and lysing the cell membrane at (a–b) 40 min and (c–d) 10 h post-exposure. Relative phosphorylation was calculated by normalizing to controls, which received vehicle control (< 1% DMSO). Error bars reflect S.E.M.
FIG. 4.
FIG. 4.
Protein phosphorylation responses of HepG2 cells to MEK inh II. From the previously determined temporal bifurcations (20 min and 8 h 20 min), relative protein phosphorylation was determined by dosing HepG2 cells with various doses of MEK inh II (1, 5, 10, 20, 50, and 100μM) and lysing the cell membrane at (a–b) 20 min and (c–d) 8 h 20 min post-exposure. Relative phosphorylation was calculated by normalizing to controls, which received vehicle control (< 1% DMSO). Error bars reflect S.E.M.
FIG. 5.
FIG. 5.
Forecasting plasma membrane degradation from two-way hierarchical cluster analysis distances. The phosphoprotein fluorescence responses of HepG2 cells to various doses of TDZD-8 (10, 20, 30, 40, 50, and 100μM) or MEK inh II (1, 5, 10, 20, 50, and 100μM) were analyzed with the unsupervised Ward two-way hierarchical clustering method. Each set of replicates was treated as a different cluster for our analyses; however, to save space, we will show the averaged fluorescence values at each time point. Shown above, cluster analyses of phosphoprotein responses to (a) TDZD-8 at 20 min post-exposure, (b) TDZD-8 at 10 h post-exposure, (c) MEK inh II at 20 min post-exposure, and (d) MEK inh II at 8 h 20 min post-exposure. After the cluster analyses were performed, the cluster distances associated with each dose are assembled and integrated across the dosing range to formulate the forecasted relative plasma membrane degradation dose-response curve (e–h). (e) Experimentally observed relative plasma membrane responses to TDZD-8 at 40 min and 24 h post-exposure are connected with red and black solid lines, respectively. The forecasted 24 h plasma membrane degradation responses that were calculated with cluster distances from 40 min post-TDZD-8 exposure phosphoprotein responses are connected with a red dashed line. (f) Experimentally observed relative plasma membrane degradation responses to TDZD-8 at 10 h and 24 h post-exposure are connected with blue and black solid lines, respectively. The forecasted 24 h plasma membrane degradation responses that were calculated with cluster distances from 10 h post-TDZD-8 exposure phosphoprotein responses are connected with a blue dashed line. (g) Experimentally observed relative plasma membrane degradation responses to MEK inh II at 20 min and 24 h post-exposure are connected with red and black solid lines, respectively. The forecasted 24 h plasma membrane degradation responses that were calculated with cluster distances from 20 min post-MEK inh II exposure phosphoprotein responses are connected with a red dashed line. (h) Experimentally observed relative plasma membrane degradation responses to MEK inh II at 8 h 20 min and 24 h post-exposure are connected with blue and black solid lines, respectively. The forecasted 24 h plasma membrane degradation responses that were calculated with cluster distances from 8 h 20 min post-exposure phosphoprotein responses are connected with a blue dashed line. For graphs in figures e–h, relative plasma membrane responses were analyzed using two-way ANOVA. Cluster-forecasted responses found to be significantly different (p < 0.05) from observed 24 h responses are marked with , cluster-forecasted responses found to be significantly different (p < 0.05) from early time point observed responses are marked with #, and observed early time point responses found to be significantly different (p < 0.05) from observed 24 h responses are marked with *. Error bars reflect ± S.E.M.
FIG. 6.
FIG. 6.
IPA of phosphoprotein responses. The most significant network interactions from the 19 different phosphoproteins measured and important intermediate proteins were compiled in IPA. Because the proteins included in the analyses did not change for all doses at both time points, only one dataset per inhibitor is shown in the figure. As examples, (a) 50μM TDZD-8 at 40 min post-exposure and (b) 50μM MEK inh II at 20 min post-exposure are included in the figure above. Normalized phosphoproteins that were greater than control are shown in red and phosphoproteins that were less than control are shown in green. IPA analysis indicated that the most significant molecular and cellular function of both inhibitor datasets were cell death and survival; specifically, apoptosis, cell survival, and necrosis were the most significant biological functions of the proteins included in the analyses.

Similar articles

Cited by

References

    1. Ainscow E. K., Brand M. D. Top-down control analysis of ATP turnover, glycolysis and oxidative phosphorylation in rat hepatocytes. Eur. J. Biochem. 1999;263:671–685. - PubMed
    1. Altekruse S. F., McGlynn K. A., Reichman M. E. Hepatocellular carcinoma incidence, mortality, and survival trends in the United States from 1975 to 2005. J. Clin. Oncol. 2009;27:1485–1491. - PMC - PubMed
    1. Anjum R., Blenis J. The RSK family of kinases: emerging roles in cellular signalling. Nat. Rev. Mol. Cell. Biol. 2008;9:747–758. - PubMed
    1. Bakare O., Ashendel C. L., Peng H., Zalkow L. H., Burgess E. M. Synthesis and MEK1 inhibitory activities of imido-substituted 2-chloro-1,4-naphthoquinones. Bioorg. Med. Chem. 2003;11:3165–3170. - PubMed
    1. Ballif B. A., Blenis J. Molecular mechanisms mediating mammalian mitogen-activated protein kinase (MAPK) Cell. Growth Differ. 2001;12:397–408. - PubMed

Publication types

Substances