. 2014 May 13;9(5):e97176.
doi: 10.1371/journal.pone.0097176. eCollection 2014.

A correspondence between individual differences in the brain's intrinsic functional architecture and the content and form of self-generated thoughts

Affiliations

A correspondence between individual differences in the brain's intrinsic functional architecture and the content and form of self-generated thoughts

Krzysztof J Gorgolewski et al. PLoS One. .

Abstract

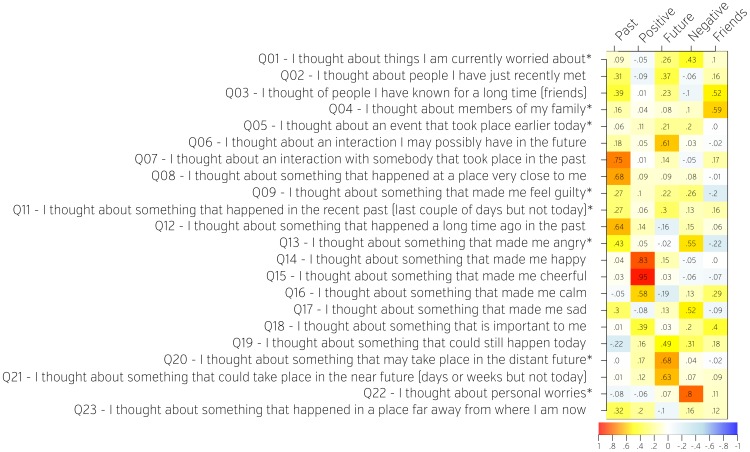
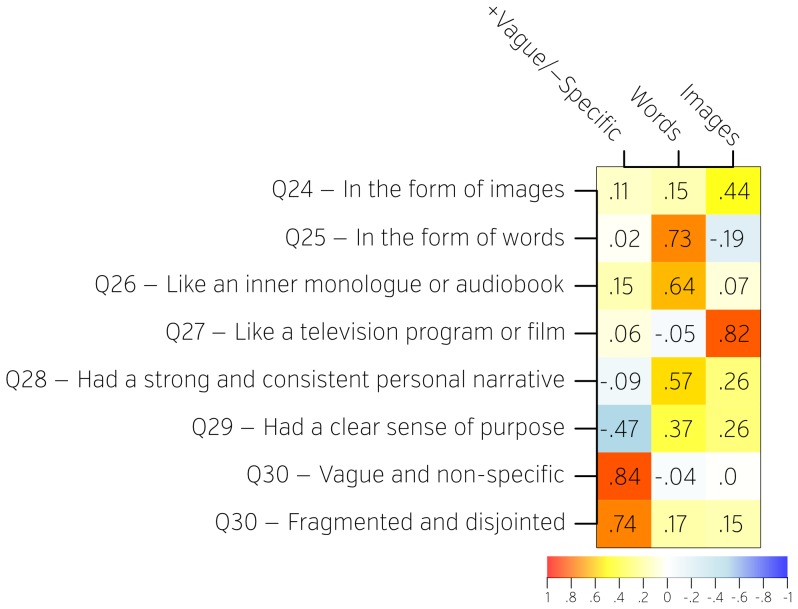
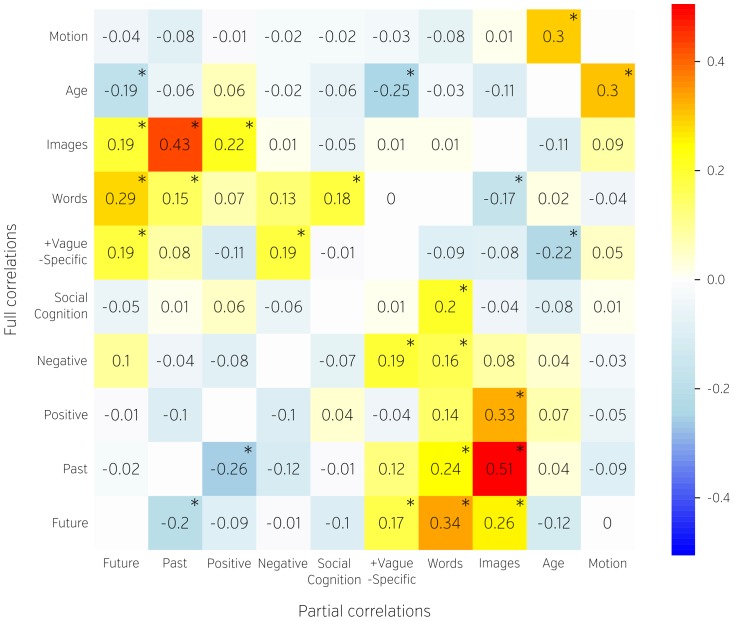
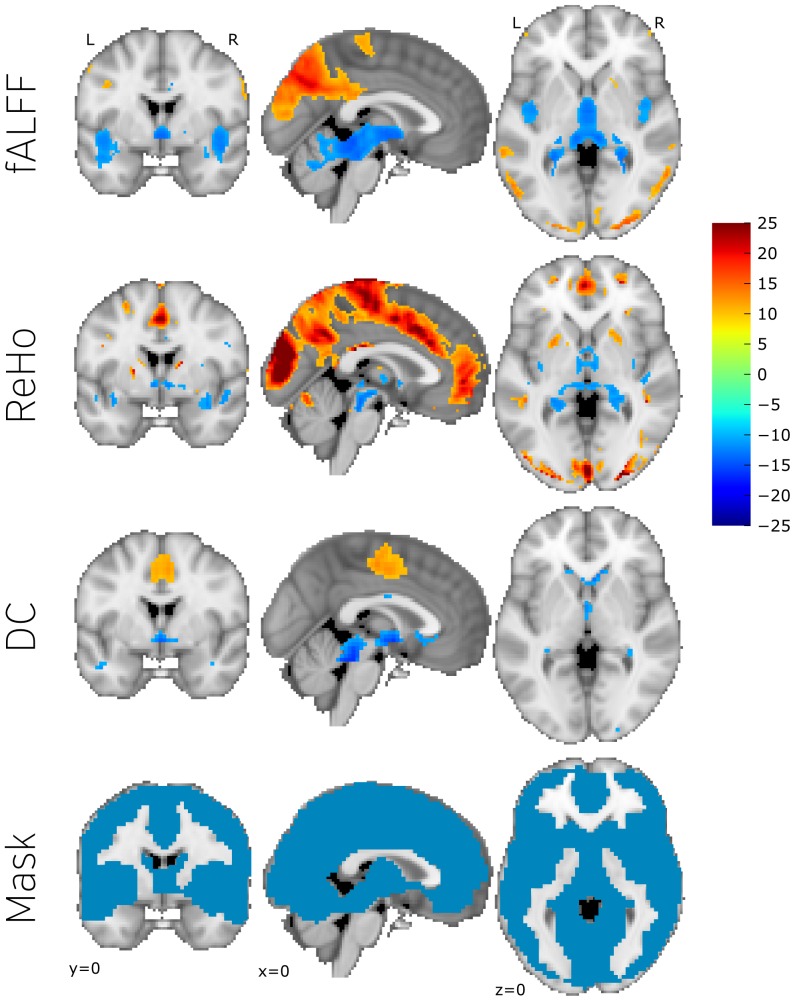
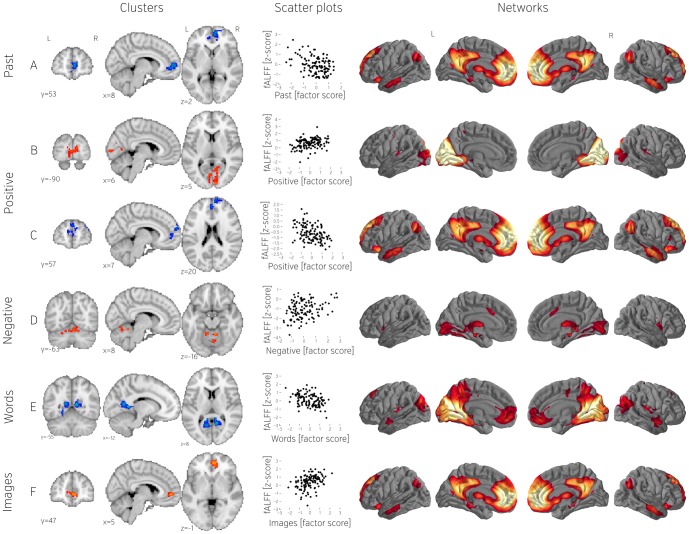
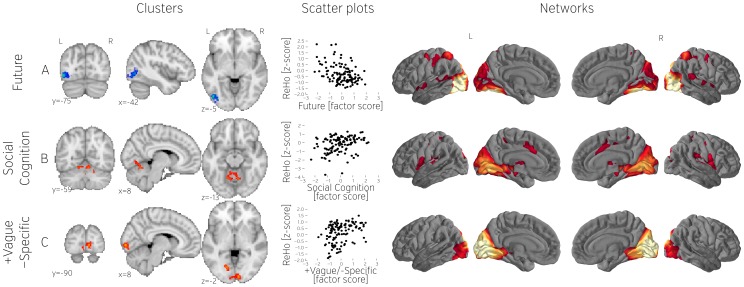
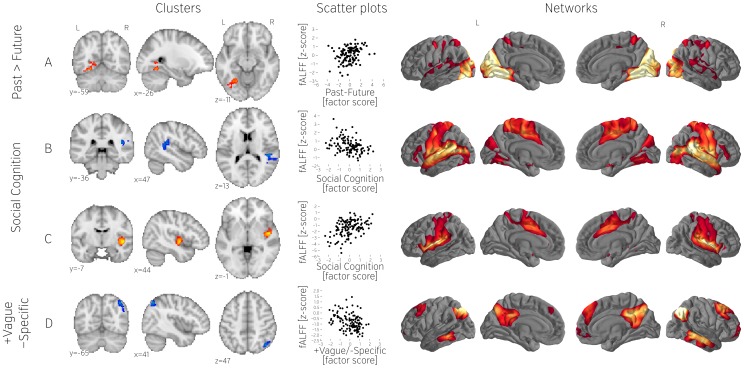
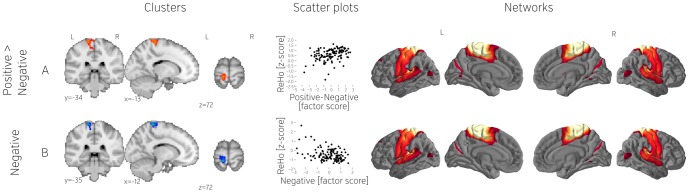
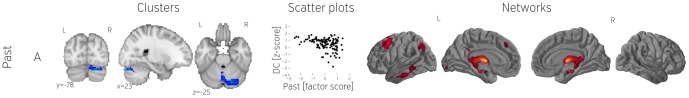
Although neural activity often reflects the processing of external inputs, intrinsic fluctuations in activity have been observed throughout the brain. These may relate to patterns of self-generated thought that can occur while not performing goal-driven tasks. To understand the relationship between self-generated mental activity and intrinsic neural fluctuations, we developed the New York Cognition Questionnaire (NYC-Q) to assess the content and form of an individual's experiences during the acquisition of resting-state fMRI data. The data were collected as a part of the Nathan Kline Rockland Enhanced sample. We decomposed NYC-Q scores using exploratory factor analysis and found that self-reported thoughts clustered into distinct dimensions of content (future related, past related, positive, negative, and social) and form (words, images, and specificity). We used these components to perform an individual difference analysis exploring how differences in the types of self-generated thoughts relate to whole brain measures of intrinsic brain activity (fractional amplitude of low frequency fluctuations, regional homogeneity, and degree centrality). We found patterns of self-generated thoughts related to changes that were distributed across a wide range of cortical areas. For example, individuals who reported greater imagery exhibited greater low frequency fluctuations in a region of perigenual cingulate cortex, a region that is known to participate in the so-called default-mode network. We also found certain forms of thought were associated with other areas, such as primary visual cortex, the insula, and the cerebellum. For example, individuals who reported greater future thought exhibited less homogeneous neural fluctuations in a region of lateral occipital cortex, a result that is consistent with the claim that particular types of self-generated thought depend on processes that are decoupled from sensory processes. These data provide evidence that self-generated thought is a heterogeneous category of experience and that studying its content can be helpful in understanding brain dynamics.


Conflict of interest statement

Competing Interests: The authors have declared that no competing interests exist.

Figures

Figure 1
Figure 1. Factor loadings on the questions from the first section of the NYC-Q describing the content of self-generated thoughts.
Questions (rows) were decomposed into factors (columns) using Exploratory Factor analysis. Factors were named based on subjective interpretation of the loadings. Weights (how much each question contributes to each factor) are represented both numerically as well as on a colour scale. Questions adapted from DSSQ are marked with an asterisk.
Figure 2
Figure 2. Factor loadings on the questions recovered from the second section of the NYC-Q describing the form of self-generated thoughts.
Questions (rows) were decomposed into factors (columns) using Exploratory Factor analysis. Factors were named based on subjective interpretation of the loadings. Weights (how much each question contributes to each factor) are represented both numerically as well as on a colour scale.
Figure 3
Figure 3. Partial (lower diagonal) and full (upper diagonal) Pearson correlations between age, head motion and estimated factors of the NYC-Q.
Numbers and colours represent r values. Significant correlations (two-tailed p = 0.025) are marked with an asterisk.
Figure 4
Figure 4. Spatial distribution of fALFF, ReHo, and DC measures across subjects.
Each map was obtained from a one sample t test, converted to z values and thresholded ad Z = 10 (for visualisation purposes). The bottom row features the data inferred mask used in the group analysis. pCC and mPFC show high ReHo values and mPFC show high fALFF values. Those are the major hubs of DMN which suggests that even without relating the measures to the questionnaire results DMN plays an important role in brain activation at rest.
Figure 5
Figure 5. Significant fALFF clusters (A–F), scatterplots showing relation between dependent variables (mean fALFF values) and contrast scores (questionnaire factors), and networks obtained by seeding with the corresponding cluster.
All derivatives have been z scored. All scatter plots represent the whole population (n = 121). Note that only clusters that passed the conservative multiple comparison corrected threshold are shown in this figure.
Figure 6
Figure 6. Significant ReHo clusters (A–C), scatterplots showing relation between dependent variables (mean ReHo values) and contrast scores (questionnaire factors), and networks obtained by seeding with the corresponding cluster.
All derivatives have been z scored. All scatterplots represents the whole population (n = 121). Note that only clusters that passed the conservative multiple comparison corrected threshold are shown in this figure.
Figure 7
Figure 7. Additional fALFF clusters found using the more liberal threshold not corrected for the number of derivatives.
From left to right: location of the clusters (A–D), scatterplots showing relation between dependent variables (mean fALFF values) and contrast scores (questionnaire factors), and networks obtained by seeding with the corresponding cluster. All derivatives have been z scored. All scatterplots represents the whole population (n = 121).
Figure 8
Figure 8. Additional ReHo clusters found using the more liberal threshold not corrected for the number of derivatives.
From left to right: location of the clusters (A–B), scatterplots showing relation between dependent variables (mean ReHo values) and contrast scores (questionnaire factors), and networks obtained by seeding with the corresponding cluster. All derivatives have been z scored. All scatterplots represents the whole population (n = 121).
Figure 9
Figure 9. Degree Centrality cluster found using the more liberal threshold not corrected for the number of derivatives.
From left to right: cluster location, scatterplot showing relation between dependent variables (mean Degree Centrality values) and contrast scores (questionnaire factors), and the network obtained by seeding with the cluster. All derivatives have been z scored. All scatterplots represents the whole population (n = 121).

References

    1. Llinas R (1988) The intrinsic electrophysiological properties of mammalian neurons: insights into central nervous system function. Science (80-) 242: : 1654–1664. Available: http://www.sciencemag.org/cgi/doi/10.1126/science.3059497. Accessed 16 August 2013. - DOI - PubMed
    1. Gilden D, Thornton T, Mallon M (1995) 1/f Noise in Human Cognition. Science (80-) 267: 4–6 Available: http://www.sciencemag.org/content/267/5205/1837.short. Accessed 5 September 2013.. - PubMed
    1. Biswal B, Zerrin Yetkin F, Haughton VM, Hyde JS (1995) Functional connectivity in the motor cortex of resting human brain using echo-planar mri. Magn Reson Med 34: : 537–541. Available: http://onlinelibrary.wiley.com/doi/10.1002/mrm.1910340409/full. Accessed 29 August 2013. - DOI - PubMed
    1. Shirer WR, Ryali S, Rykhlevskaia E, Menon V, Greicius MD (2012) Decoding subject-driven cognitive states with whole-brain connectivity patterns. Cereb Cortex 22: : 158–165. Available: http://www.ncbi.nlm.nih.gov/pubmed/21616982. Accessed 30 October 2012. - PMC - PubMed
    1. Preminger S, Harmelech T, Malach R (2011) Stimulus-free thoughts induce differential activation in the human default network. Neuroimage 54: : 1692–1702. Available: http://www.ncbi.nlm.nih.gov/pubmed/20728555. Accessed 13 November 2012. - PubMed