

Long-term changes in dietary and food intake behaviour in the Diabetes Prevention Program Outcomes Study
- PMID: 24824893
- PMCID: PMC4307949
- DOI: 10.1111/dme.12500
Long-term changes in dietary and food intake behaviour in the Diabetes Prevention Program Outcomes Study
Abstract
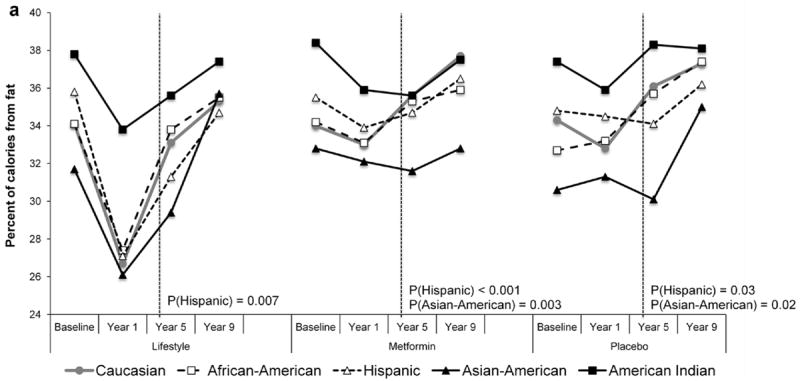
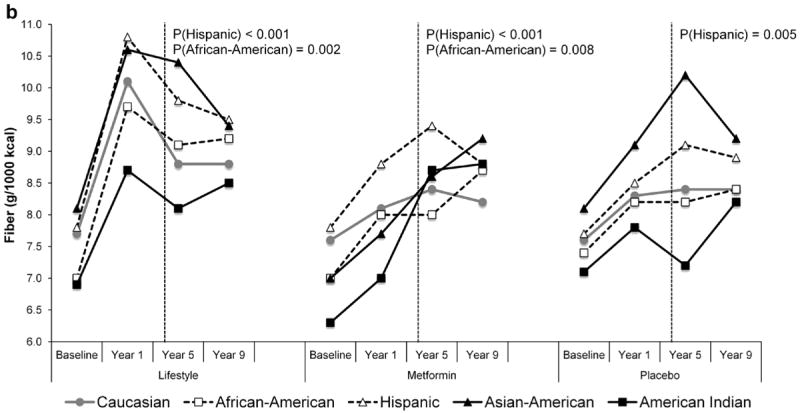
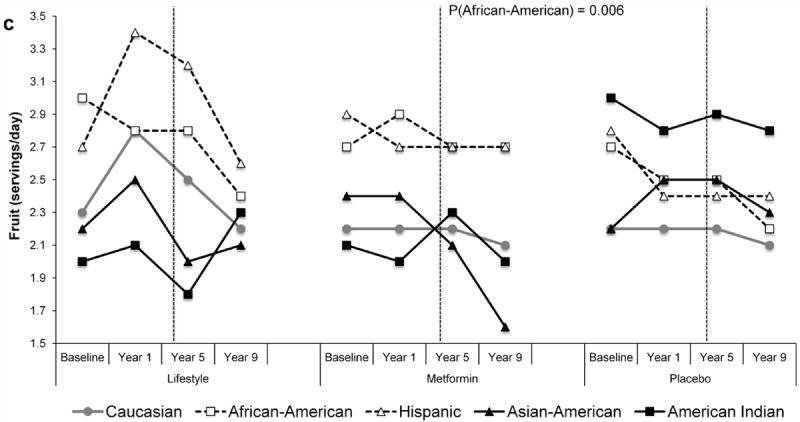
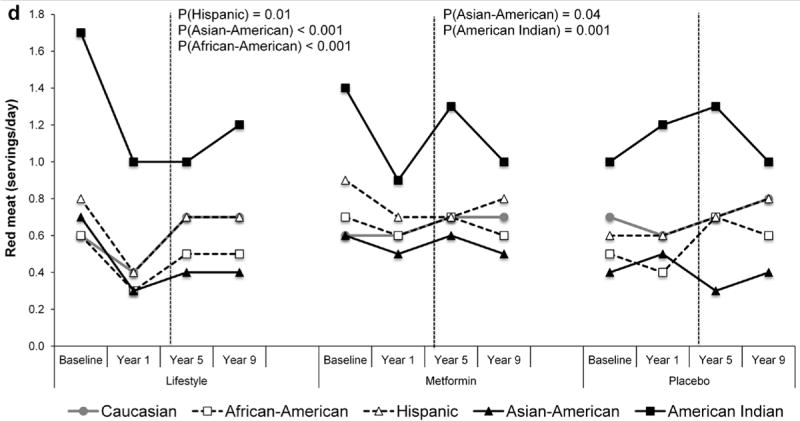
Aims: To compare change in dietary intake, with an emphasis on food groups and food intake behaviour, over time across treatment arms in a diabetes prevention trial and to assess the differences in dietary intake among demographic groups within treatment arms.
Methods: Data are from the Diabetes Prevention Program and Diabetes Prevention Program Outcomes Study. Participants were randomized to a lifestyle intervention (n = 1079), metformin (n = 1073) or placebo (n = 1082) for an average of 3 years, after which the initial results regarding the benefits of the lifestyle intervention were released and all participants were offered a modified lifestyle intervention. Dietary intake was assessed using a food frequency questionnaire at baseline and at 1, 5, 6 and 9 years after randomization.
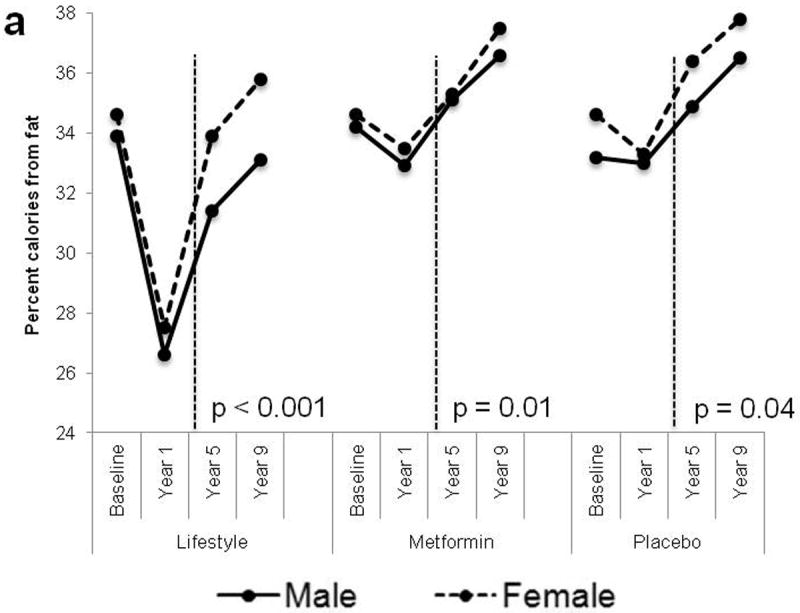
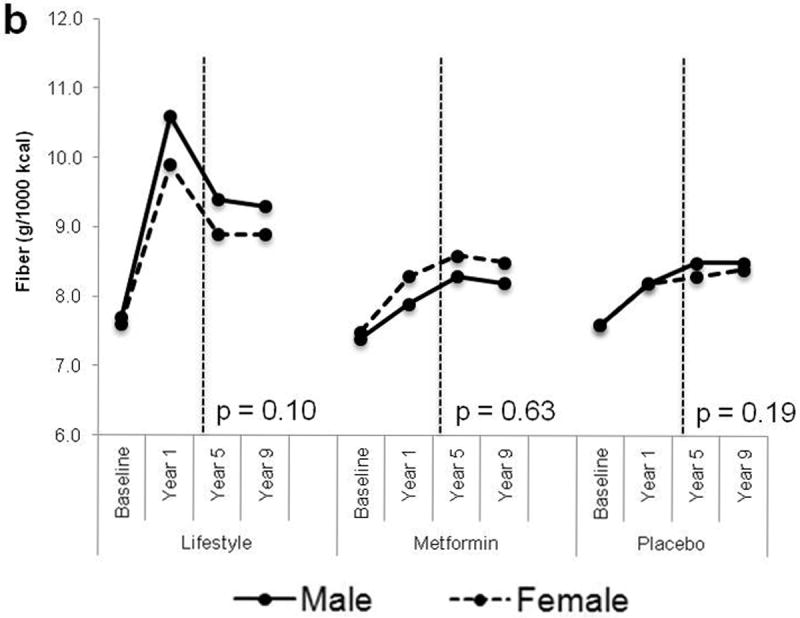
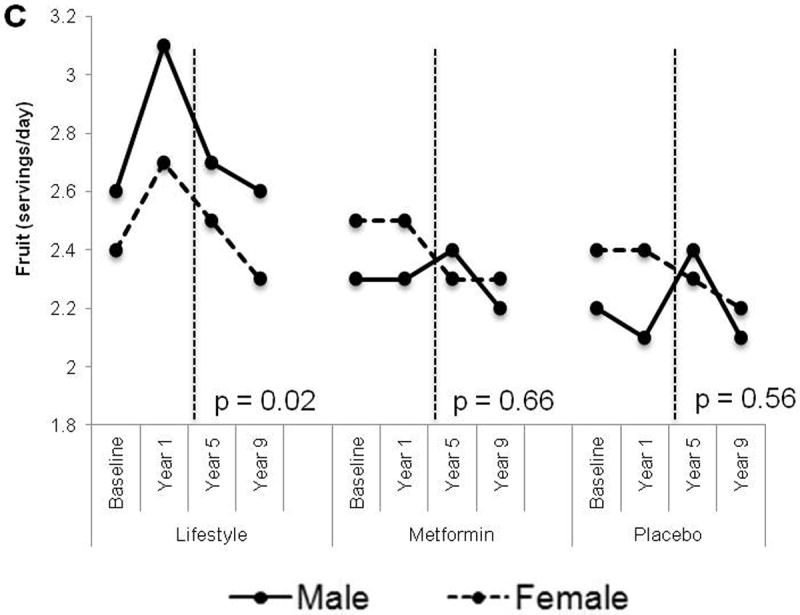
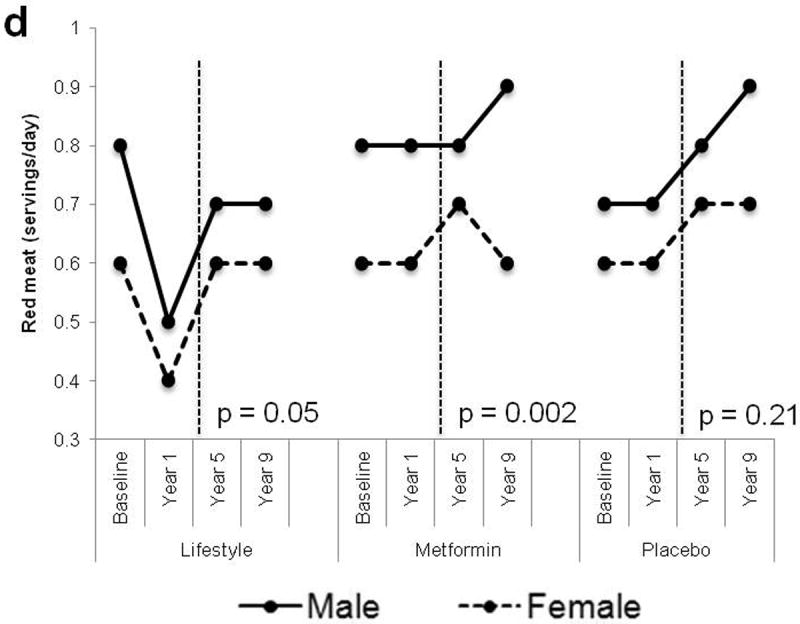
Results: Compared with the metformin and placebo arms, participants in the lifestyle arm maintained a lower total fat and saturated fat and a higher fibre intake up to 9 years after randomization and lower intakes of red meat and sweets were maintained for up to 5 years. Younger participants had higher intakes of poultry and lower intakes of fruits compared with their older counterparts, particularly in the lifestyle arm. Black participants tended to have lower dairy and higher poultry intakes compared with white and Hispanic participants. In the lifestyle arm, men tended to have higher grain, fruit and fish intakes than women.
Conclusions: Changes in nutrient intake among participants in the lifestyle intervention were maintained for up to 9 years. Younger participants reported more unhealthy diets over time and thus may benefit from additional support to achieve and maintain dietary goals.
© 2014 The Authors. Diabetic Medicine © 2014 Diabetes UK.
Conflict of interest statement
Figures
Similar articles
-
Predictors of sustained reduction in energy and fat intake in the Diabetes Prevention Program Outcomes Study intensive lifestyle intervention.J Acad Nutr Diet. 2013 Nov;113(11):1455-1464. doi: 10.1016/j.jand.2013.07.003. J Acad Nutr Diet. 2013. PMID: 24144073 Free PMC article. Clinical Trial.
-
Comparison of a dietary intervention promoting high intakes of fruits and vegetables with a low-fat approach: long-term effects on dietary intakes, eating behaviours and body weight in postmenopausal women.Br J Nutr. 2010 Oct;104(7):1080-90. doi: 10.1017/S0007114510001716. Epub 2010 May 19. Br J Nutr. 2010. PMID: 20482930 Clinical Trial.
-
The influence of a physician and patient intervention program on dietary intake.J Acad Nutr Diet. 2013 Nov;113(11):1465-1475. doi: 10.1016/j.jand.2013.06.343. Epub 2013 Aug 30. J Acad Nutr Diet. 2013. PMID: 23999279 Free PMC article. Clinical Trial.
-
Metformin for diabetes prevention: insights gained from the Diabetes Prevention Program/Diabetes Prevention Program Outcomes Study.Diabetologia. 2017 Sep;60(9):1601-1611. doi: 10.1007/s00125-017-4361-9. Epub 2017 Aug 2. Diabetologia. 2017. PMID: 28770322 Free PMC article. Review.
-
[Steps toward the primary prevention of type II diabetes mellitus. Various epidemiological considerations].Invest Clin. 1997 Mar;38(1):39-52. Invest Clin. 1997. PMID: 9235072 Review. Spanish.
Cited by
-
Evaluation of a Workplace Diabetes Prevention Program Delivered via Distance Learning: A Qualitative Study.Health Educ Behav. 2025 Apr;52(2):156-165. doi: 10.1177/10901981241285433. Epub 2024 Oct 6. Health Educ Behav. 2025. PMID: 39370708 Free PMC article.
-
Diet quality, weight loss, and diabetes incidence in the Diabetes Prevention Program (DPP).BMC Nutr. 2020 Dec 15;6(1):74. doi: 10.1186/s40795-020-00400-4. BMC Nutr. 2020. PMID: 33317629 Free PMC article.
-
A Simple Liking Survey Captures Behaviors Associated with Weight Loss in a Worksite Program among Women at Risk of Type 2 Diabetes.Nutrients. 2021 Apr 17;13(4):1338. doi: 10.3390/nu13041338. Nutrients. 2021. PMID: 33920626 Free PMC article.
-
A Randomized Controlled Trial Translating the Diabetes Prevention Program to a University Worksite, Ohio, 2012-2014.Prev Chronic Dis. 2015 Nov 25;12:E210. doi: 10.5888/pcd12.150301. Prev Chronic Dis. 2015. PMID: 26605710 Free PMC article. Clinical Trial.
-
Meaningfully reducing consumption of meat and animal products is an unsolved problem: A meta-analysis.Res Sq [Preprint]. 2025 Mar 19:rs.3.rs-5486065. doi: 10.21203/rs.3.rs-5486065/v1. Res Sq. 2025. Update in: Appetite. 2025 Aug 5;216:108233. doi: 10.1016/j.appet.2025.108233. PMID: 40166031 Free PMC article. Updated. Preprint.
References
-
- International Diabetes Federation. Diabetes Atlas. 5. Brussels: International Diabetes Federation; 2011.
-
- Pan XR, Li GW, Hu YH, Wang JX, Yang WY, An ZX, et al. Effects of diet and exercise in preventing NIDDM in people with impaired glucose tolerance. The Da Qing IGT and Diabetes Study. Diabetes Care. 1997;20(4):537–44. - PubMed
-
- Saito T, Watanabe M, Nishida J, Izumi T, Omura M, Takagi T, et al. Lifestyle modification and prevention of type 2 diabetes in overweight Japanese with impaired fasting glucose levels: a randomized controlled trial. Arch Intern Med. 2011;171(15):1352–60. - PubMed
Publication types
MeSH terms
Substances
Grants and funding
LinkOut - more resources
Full Text Sources
Other Literature Sources
Medical
