Involvement of IL-18 in the expansion of unique hepatic T cells with unconventional cytokine profiles during Schistosoma mansoni infection
- PMID: 24824897
- PMCID: PMC4019514
- DOI: 10.1371/journal.pone.0096042
Involvement of IL-18 in the expansion of unique hepatic T cells with unconventional cytokine profiles during Schistosoma mansoni infection
Abstract
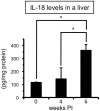
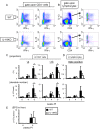
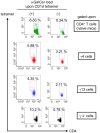
Infection with schistosomes invokes severe fibrotic granulomatous responses in the liver of the host. Schistosoma mansoni infection induces dramatic fluctuations in Th1 or Th2 cytokine responses systemically; Th1 reactions are provoked in the early phase, whilst Th2 responses become dominant after oviposition begins. In the liver, various unique immune cells distinct from those of conventional immune competent organs or tissues exist, resulting in a unique immunological environment. Recently, we demonstrated that S. mansoni infection induces unique CD4+ T cell populations exhibiting unconventional cytokine profiles in the liver of mice during the period between Th1- and Th2-phases, which we term the transition phase. They produce both IFN-γ and IL-4 or both IFN-γ and IL-13 simultaneously. Moreover, T cells secreting triple cytokines IFN-γ, IL-13 and IL-4 were also induced. We term these cells Multiple Cytokine Producing Hepatic T cells (MCPHT cells). During the transition phase, when MCPHT cells increase, IL-18 secretion was up-regulated in the liver and sera. In S. mansoni-infected IL-18-deficient mice, expansion of MCPHT cells was curtailed. Thus our data suggest that IL-18 produced during S. mansoni infection play a role in the expansion of MCPHT cells.
Conflict of interest statement
Figures


Similar articles
-
Unique T cells with unconventional cytokine profiles induced in the livers of mice during Schistosoma mansoni infection.PLoS One. 2013 Dec 16;8(12):e82698. doi: 10.1371/journal.pone.0082698. eCollection 2013. PLoS One. 2013. PMID: 24358216 Free PMC article.
-
Kupffer cells from Schistosoma mansoni-infected mice participate in the prompt type 2 differentiation of hepatic T cells in response to worm antigens.J Immunol. 1999 Dec 15;163(12):6702-11. J Immunol. 1999. PMID: 10586067
-
Interleukin-10-mediated T cell apoptosis during the T helper type 2 cytokine response in murine Schistosoma mansoni parasite infection.Eur Cytokine Netw. 1997 Jun;8(2):153-60. Eur Cytokine Netw. 1997. PMID: 9262964
-
Strongyloides venezuelensis-infection alters the profile of cytokines and liver inflammation in mice co-infected with Schistosoma mansoni.Cytokine. 2020 Mar;127:154931. doi: 10.1016/j.cyto.2019.154931. Epub 2019 Nov 26. Cytokine. 2020. PMID: 31783260
-
T Lymphocyte-Mediated Liver Immunopathology of Schistosomiasis.Front Immunol. 2020 Feb 18;11:61. doi: 10.3389/fimmu.2020.00061. eCollection 2020. Front Immunol. 2020. PMID: 32132991 Free PMC article. Review.
Cited by
-
Age-dependent rise in IFN-γ competence undermines effective type 2 responses to nematode infection.Mucosal Immunol. 2022 Jun;15(6):1270-1282. doi: 10.1038/s41385-022-00519-6. Epub 2022 Jun 11. Mucosal Immunol. 2022. PMID: 35690651 Free PMC article.
-
Advances in the Diagnosis of Human Schistosomiasis.Clin Microbiol Rev. 2015 Oct;28(4):939-67. doi: 10.1128/CMR.00137-14. Clin Microbiol Rev. 2015. PMID: 26224883 Free PMC article. Review.
-
The Differentiation of CD4(+) T-Helper Cell Subsets in the Context of Helminth Parasite Infection.Front Immunol. 2014 Oct 15;5:487. doi: 10.3389/fimmu.2014.00487. eCollection 2014. Front Immunol. 2014. PMID: 25360134 Free PMC article. Review.
References
-
- Jankovic D, Liu Z, Gause WC (2001) Th1- and Th2-cell commitment during infectious disease: asymmetry in divergent pathways. Trends Immunol 22: 450–457. - PubMed
-
- Infante-Duarte C, Kamradt T (1999) Th1/Th2 balance in infection. Springer Semin Immunopathol 21: 317–338. - PubMed
-
- Gately MK, Renzetti LM, Magram J, Stern AS, Adorini L, et al. (1998) The interleukin-12/interleukin-12-receptor system: role in normal and pathologic immune responses. Annu Rev Immunol 16: 495–521. - PubMed
-
- Liblau RS, Singer SM, McDevitt HO (1995) Th1 and Th2 CD4+ T cells in the pathogenesis of organ-specific autoimmune diseases. Immunol Today 16: 34–38. - PubMed
-
- Charlton B, Lafferty KJ (1995) The Th1/Th2 balance in autoimmunity. Curr Opin Immunol 7: 793–798. - PubMed
Publication types
MeSH terms
Substances
LinkOut - more resources
Full Text Sources
Other Literature Sources
Research Materials
Miscellaneous

