Depth and medium-scale spatial processes influence fish assemblage structure of unconsolidated habitats in a subtropical marine park
- PMID: 24824998
- PMCID: PMC4019521
- DOI: 10.1371/journal.pone.0096798
Depth and medium-scale spatial processes influence fish assemblage structure of unconsolidated habitats in a subtropical marine park
Abstract
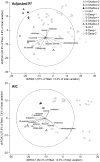
Where biological datasets are spatially limited, abiotic surrogates have been advocated to inform objective planning for Marine Protected Areas. However, this approach assumes close correlation between abiotic and biotic patterns. The Solitary Islands Marine Park, northern NSW, Australia, currently uses a habitat classification system (HCS) to assist with planning, but this is based only on data for reefs. We used Baited Remote Underwater Videos (BRUVs) to survey fish assemblages of unconsolidated substrata at different depths, distances from shore, and across an along-shore spatial scale of 10 s of km (2 transects) to examine how well the HCS works for this dominant habitat. We used multivariate regression modelling to examine the importance of these, and other environmental factors (backscatter intensity, fine-scale bathymetric variation and rugosity), in structuring fish assemblages. There were significant differences in fish assemblages across depths, distance from shore, and over the medium spatial scale of the study: together, these factors generated the optimum model in multivariate regression. However, marginal tests suggested that backscatter intensity, which itself is a surrogate for sediment type and hardness, might also influence fish assemblages and needs further investigation. Species richness was significantly different across all factors: however, total MaxN only differed significantly between locations. This study demonstrates that the pre-existing abiotic HCS only partially represents the range of fish assemblages of unconsolidated habitats in the region.
Conflict of interest statement
Figures


References
-
- Ward TJ, Vanderklift MA, Nicholls AO, Kenchington RA (1999) Selecting marine reserves using habitats and species assemblages as surrogates for biological diversity. Ecol Appl 9: 691–698.
-
- Curley BG, Kingsford MJ, Gillanders BM (2002) Spatial and habitat-related patterns of temperate reef fish assemblages: implications for the design of Marine Protected Areas. Mar Freshw Res 53: 1197–1210.
-
- Gladstone W (2002) The potential value of indicator groups in the selection of marine reserves. Biol Conserv 104: 211–220.
-
- Smith SDA (2005) Rapid assessment of invertebrate biodiversity on rocky shores: where there's a whelk there's a way. Biodivers Conserv 14: 3565–3576.
-
- Gladstone W (2007) Requirements for marine protected areas to conserve the biodiversity of rocky reef fishes. Aquat Conserv 17: 71–80.
Publication types
MeSH terms
LinkOut - more resources
Full Text Sources
Other Literature Sources

