T-regulatory cells and programmed death 1+ T cells contribute to effector T-cell dysfunction in patients with chronic obstructive pulmonary disease
- PMID: 24825462
- PMCID: PMC4226027
- DOI: 10.1164/rccm.201312-2293OC
T-regulatory cells and programmed death 1+ T cells contribute to effector T-cell dysfunction in patients with chronic obstructive pulmonary disease
Abstract
Rationale: Previous studies from our laboratory have shown that peripheral blood mononuclear cells (PBMCs) from patients with chronic obstructive pulmonary disease (COPD) prone to exacerbations with nontypeable Haemophilus influenzae have impaired responses to lipoprotein P6. We hypothesized that an underlying immunosuppressive network could be responsible for the defective antibacterial immunity observed in these patients. We evaluated T regulatory cells (Tregs), myeloid-derived suppressor cells (MDSC), and exhausted T effector cells (programmed death 1 [PD-1](+)) in patients with COPD, because these cells are known to play a pivotal role in suppressing immune responses.
Objectives: We performed an in-depth characterization of Tregs, T effector cells, and MDSC in COPD and correlated their levels and function with disease severity.
Methods: Treg, effector T cell, and MDSC frequency from patients with COPD and healthy subjects' PBMCs were analyzed by flow cytometry. Treg immunosuppressive capacity was measured by in vitro suppression assay. The frequency of interferon-γ producing T cells and T-cell proliferation were measured after blocking CTLA-4 and PD-1. Plasma proinflammatory and immunosuppressive cytokine levels were measured.
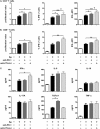
Measurements and main results: Significantly increased levels of Tregs, MDSC, and PD-1(+) exhausted effector T cells were present in patients with COPD compared with healthy subjects. Tregs from patients with COPD suppressed P6-specific T-cell proliferation to a greater extent than Tregs from healthy subjects. Plasma levels of Treg-generated cytokines, IL-10, and transforming growth factor-β were elevated. Blockade of CTLA-4 resulted in significant augmentation of T-cell IFN-γ production in patients with COPD.
Conclusions: Functionally suppressive Tregs, MDSCs, and exhausted PD-1(+) T cells contribute to effector T-cell dysfunction in COPD.
Keywords: Foxp3+ Tregs; T effector cells; cytokines; lung function; myeloid-derived suppressor cells.
Figures


Comment in
- doi: 10.1164/rccm.201406-0997ED
Similar articles
-
The clinical association of programmed death-1/PD-L1 axis, myeloid derived suppressor cells subsets and regulatory T cells in peripheral blood of stable COPD patients.PeerJ. 2024 Mar 27;12:e16988. doi: 10.7717/peerj.16988. eCollection 2024. PeerJ. 2024. PMID: 38560459 Free PMC article.
-
Imbalance of peripheral blood Th17 and Treg responses in patients with chronic obstructive pulmonary disease.Clin Respir J. 2015 Jul;9(3):330-41. doi: 10.1111/crj.12147. Epub 2014 May 21. Clin Respir J. 2015. PMID: 24720797
-
Higher frequencies of GARP(+)CTLA-4(+)Foxp3(+) T regulatory cells and myeloid-derived suppressor cells in hepatocellular carcinoma patients are associated with impaired T-cell functionality.Cancer Res. 2013 Apr 15;73(8):2435-44. doi: 10.1158/0008-5472.CAN-12-3381. Epub 2013 Feb 19. Cancer Res. 2013. PMID: 23423978 Free PMC article.
-
Immune Dysfunction in Patients with Chronic Obstructive Pulmonary Disease.Ann Am Thorac Soc. 2015 Nov;12 Suppl 2(Suppl 2):S169-75. doi: 10.1513/AnnalsATS.201503-126AW. Ann Am Thorac Soc. 2015. PMID: 26595735 Free PMC article. Review.
-
Regulatory T cells in the blood of patients with chronic obstructive pulmonary disease (COPD): A systematic review and meta-analysis.Respir Med. 2025 Jun;242:108104. doi: 10.1016/j.rmed.2025.108104. Epub 2025 Apr 15. Respir Med. 2025. PMID: 40246247
Cited by
-
Infiltration of IL-17-Producing T Cells and Treg Cells in a Mouse Model of Smoke-Induced Emphysema.Inflammation. 2016 Aug;39(4):1334-44. doi: 10.1007/s10753-016-0365-8. Inflammation. 2016. PMID: 27150336
-
Regulatory T Cells in Respiratory Health and Diseases.Pulm Med. 2019 Nov 20;2019:1907807. doi: 10.1155/2019/1907807. eCollection 2019. Pulm Med. 2019. PMID: 31827925 Free PMC article. Review.
-
Endothelial progenitor cell number and ERK phosphorylation serve as predictive and prognostic biomarkers in advanced hepatocellular carcinoma patients treated with sorafenib.Oncoimmunology. 2016 Sep 20;5(10):e1226718. doi: 10.1080/2162402X.2016.1226718. eCollection 2016. Oncoimmunology. 2016. PMID: 27853648 Free PMC article.
-
Janus-faced Acrolein prevents allergy but accelerates tumor growth by promoting immunoregulatory Foxp3+ cells: Mouse model for passive respiratory exposure.Sci Rep. 2017 Mar 23;7:45067. doi: 10.1038/srep45067. Sci Rep. 2017. PMID: 28332605 Free PMC article.
-
COPD and Immune Checkpoint Inhibitors for Cancer: A Literature Review.Int J Chron Obstruct Pulmon Dis. 2024 Dec 9;19:2689-2703. doi: 10.2147/COPD.S490252. eCollection 2024. Int J Chron Obstruct Pulmon Dis. 2024. PMID: 39677829 Free PMC article. Review.
References
-
- Sethi S, Murphy TF. Infection in the pathogenesis and course of chronic obstructive pulmonary disease. N Engl J Med. 2008;359:2355–2365. - PubMed
-
- Barnes PJ. Chronic obstructive pulmonary disease. N Engl J Med. 2000;343:269–280. - PubMed
-
- Abe Y, Murphy TF, Sethi S, Faden HS, Dmochowski J, Harabuchi Y, Thanavala YM. Lymphocyte proliferative response to P6 of Haemophilus influenzae is associated with relative protection from exacerbations of chronic obstructive pulmonary disease. Am J Respir Crit Care Med. 2002;165:967–971. - PubMed
-
- Lan RY, Ansari AA, Lian ZX, Gershwin ME. Regulatory T cells: development, function and role in autoimmunity. Autoimmun Rev. 2005;4:351–363. - PubMed
Publication types
MeSH terms
Substances
Grants and funding
LinkOut - more resources
Full Text Sources
Other Literature Sources
Medical
Research Materials

