

Exercise training reduces resting heart rate via downregulation of the funny channel HCN4
- PMID: 24825544
- PMCID: PMC4024745
- DOI: 10.1038/ncomms4775
Exercise training reduces resting heart rate via downregulation of the funny channel HCN4
Abstract
Endurance athletes exhibit sinus bradycardia, that is a slow resting heart rate, associated with a higher incidence of sinus node (pacemaker) disease and electronic pacemaker implantation. Here we show that training-induced bradycardia is not a consequence of changes in the activity of the autonomic nervous system but is caused by intrinsic electrophysiological changes in the sinus node. We demonstrate that training-induced bradycardia persists after blockade of the autonomous nervous system in vivo in mice and in vitro in the denervated sinus node. We also show that a widespread remodelling of pacemaker ion channels, notably a downregulation of HCN4 and the corresponding ionic current, If. Block of If abolishes the difference in heart rate between trained and sedentary animals in vivo and in vitro. We further observe training-induced downregulation of Tbx3 and upregulation of NRSF and miR-1 (transcriptional regulators) that explains the downregulation of HCN4. Our findings provide a molecular explanation for the potentially pathological heart rate adaptation to exercise training.
Figures

 in the rat following the 12-week training period. Normalized
  of sedentary and trained rats before and after the 12-week training period shown (n=11 per group). In all bar graphs: black bars represent data from sedentary animals and hatched bars represent data from trained animals. (b) Significant correlation between heart rate in vitro and normalized
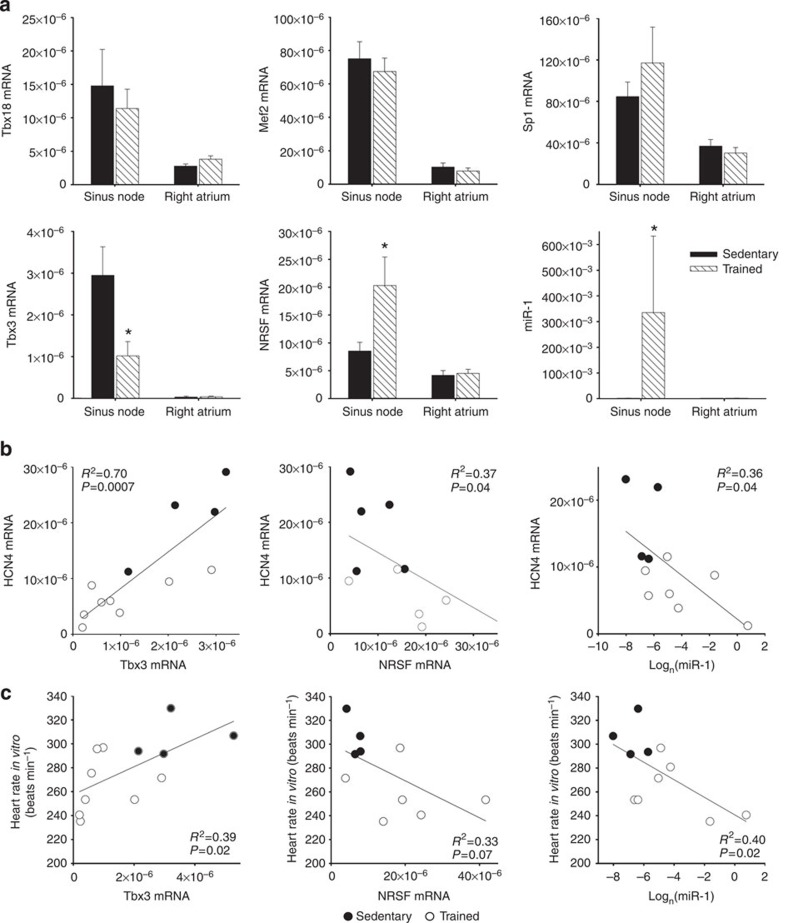
  in sedentary and trained rats (measured after 12-week training period). Each point corresponds to a different animal. Data fit with a straight line by linear regression (n=5/9; R2 and P values shown). (c) Representative ECG traces obtained from sedentary and trained (unrestrained and conscious) rats and mice demonstrating longer RR intervals in trained animals. (d,e) Mean (+s.e.m.) RR intervals (d) and corresponding heart rates (e) measured in vivo (rats, n=5/9; mice, n=6/8) and in vitro (from isolated sinus node preparations; rats, n=5/9; mice, n=6/7) in sedentary and trained animals. (f) Mean (+s.e.m.) heart rate measured in vivo in conscious mice at baseline (n=9/11) and after complete autonomic block with propranolol and atropine (n=7/14). (g) Mean (+s.e.m.) sympathetic tone and vagal tone in conscious sedentary and trained mice (n=6/6). (h) Expression of transcripts in the sinus node (grey bars) and atrial muscle (open bars) of trained rats as a percentage of that of sedentary rats. The vertical line corresponds to 100%, that is, no change. Values <100% correspond to a decrease on training and >100% an increase. Student’s t-test used to test differences between data from trained and sedentary animals. Normal distribution of data was tested using the Shapiro–Wilk W-test and equal variance was tested using the F-test. When the null hypothesis of normality and/or equal variance was rejected, the non-parametric Mann–Whitney U-test was used. *P<0.05.
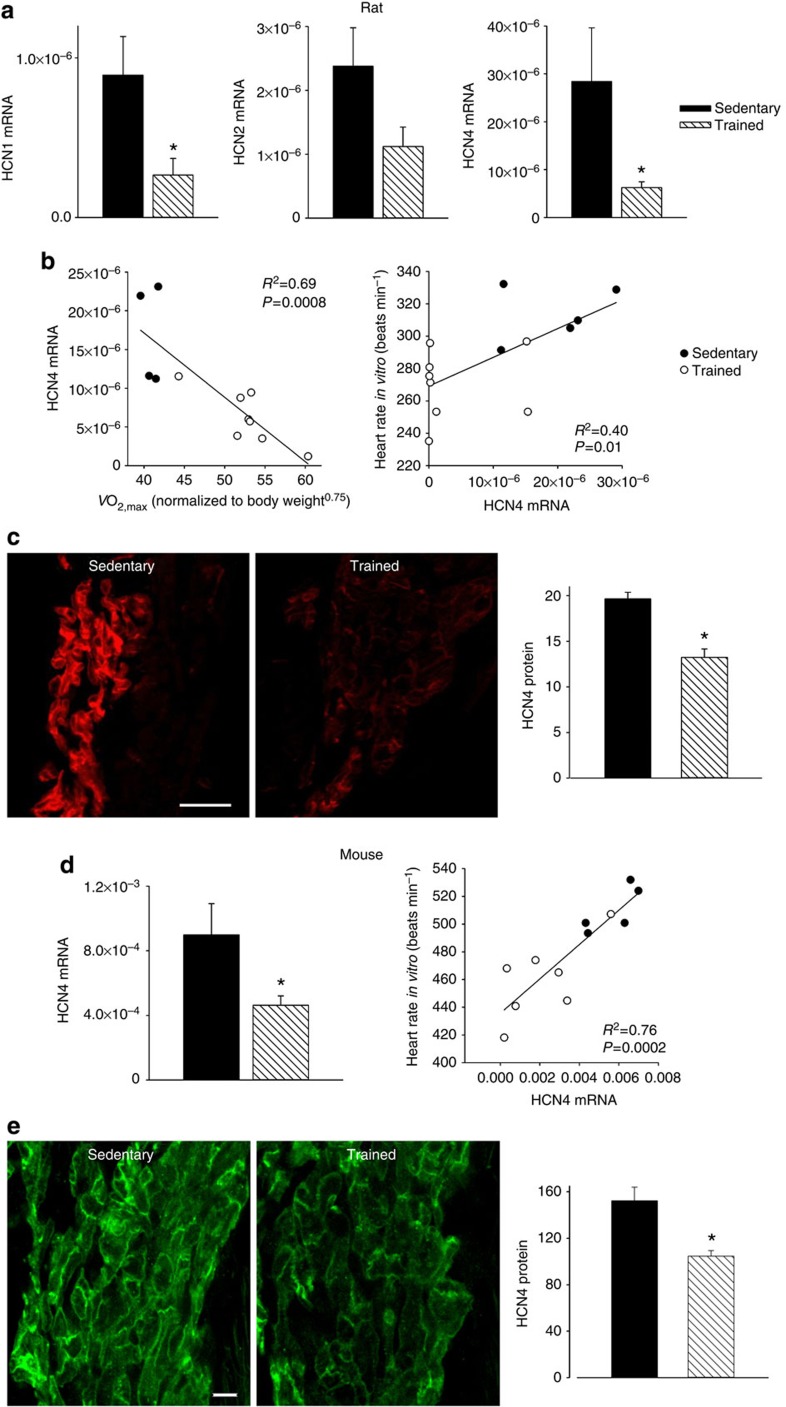
 (left) and heart rate in vitro and HCN4 mRNA (right) in sedentary and trained rats. Each point corresponds to a different animal. In all scatter plots: filled circles represent data from sedentary animals, and open circles represent data from trained animals. Data fit with straight lines by linear regression (n=4/8; R2 and P values shown). (c) Downregulation of HCN4 protein in trained rats. Representative images of HCN4 immunolabelling (red signal) in the sinus node of sedentary and trained rats are shown in the left and middle panels, respectively (scale bar, 100 μm). The right panel shows the mean (+s.e.m.) HCN4 protein expression quantified using ImageJ from the NIH (n=4). (d) Downregulation of mRNA for HCN4 in trained mice. The left panel shows the mean (+s.e.m.) expression of HCN4 mRNA (normalized to expression of 18S) in the sinus node of sedentary and trained mice (n=6/7) and the right panel shows a significant correlation between heart rate in vitro and HCN4 mRNA in sedentary and trained mice. Each point corresponds to a different animal. Data fit with a straight line by linear regression (n=5/7; R2 and P values shown). (e) Downregulation of HCN4 protein in trained mice. Representative images of HCN4 immunolabelling (green signal) in the sinus node of sedentary and trained mice are shown in the left and middle panels, respectively (scale bar, 10 μm). The right panel shows mean (+s.e.m.) HCN4 protein expression (n=4). Student’s t-test used to test differences between data from sedentary and trained animals. Normal distribution of data was tested using the Shapiro–Wilk W-test and equal variance was tested using the F-test. When the null hypothesis of normality and/or equal variance was rejected, the non-parametric Mann–Whitney U-test was used. *P<0.05.
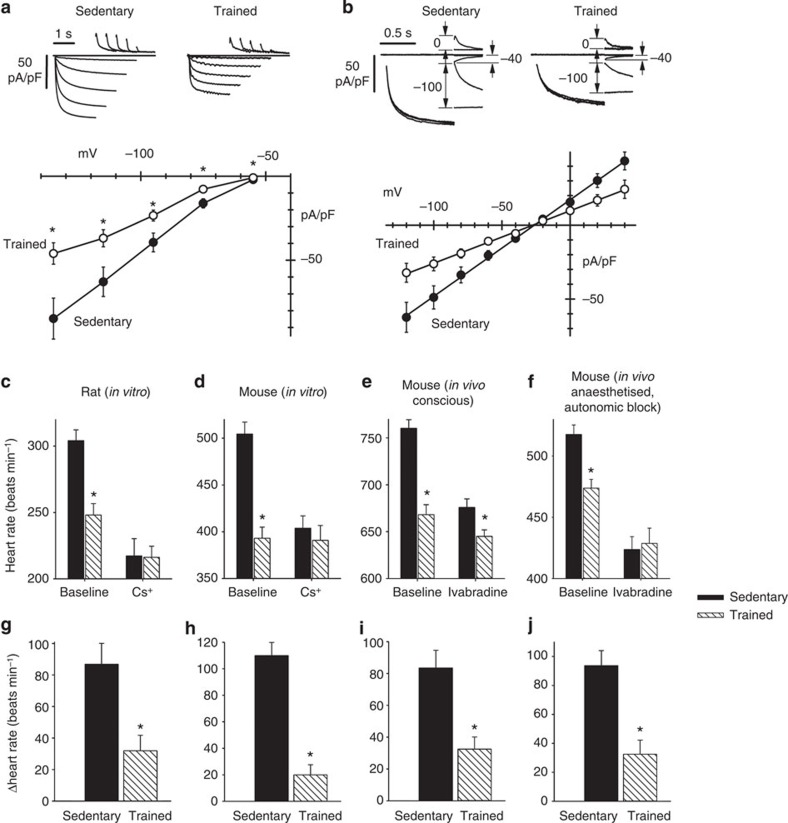
Comment in
-
Elite youth sports.Pediatr Exerc Sci. 2015 Feb;27(1):18-20. doi: 10.1123/pes.2015-0029. Pediatr Exerc Sci. 2015. PMID: 25822960 No abstract available.
References
-
- Mont L. et al. Long-lasting sport practice and lone atrial fibrillation. Eur. Heart. J. 23, 477–482 (2002). - PubMed
-
- Biffi A. et al. Long-term clinical significance of frequent and complex ventricular tachyarrhythmias in trained athletes. J. Am. Coll. Cardiol. 40, 446–452 (2002). - PubMed
-
- Whyte G. P. Clinical significance of cardiac damage and changes in function after exercise. Med. Sci. Sports. Exerc. 40, 1416–1423 (2008). - PubMed
-
- Heidbuchel H. et al. High prevalence of right ventricular involvement in endurance athletes with ventricular arrhythmias. Role of an electrophysiologic study in risk stratification. Eur. Heart. J. 24, 1473–1480 (2003). - PubMed
Publication types
MeSH terms
Substances
Grants and funding
LinkOut - more resources
Full Text Sources
Other Literature Sources
