. 2014 Aug;44(8):2318-30.
doi: 10.1002/eji.201344350. Epub 2014 Jun 11.

Resolving Salmonella infection reveals dynamic and persisting changes in murine bone marrow progenitor cell phenotype and function

Affiliations
Free PMC article

Resolving Salmonella infection reveals dynamic and persisting changes in murine bone marrow progenitor cell phenotype and function

Ewan A Ross et al. Eur J Immunol. 2014 Aug.
Free PMC article

Abstract

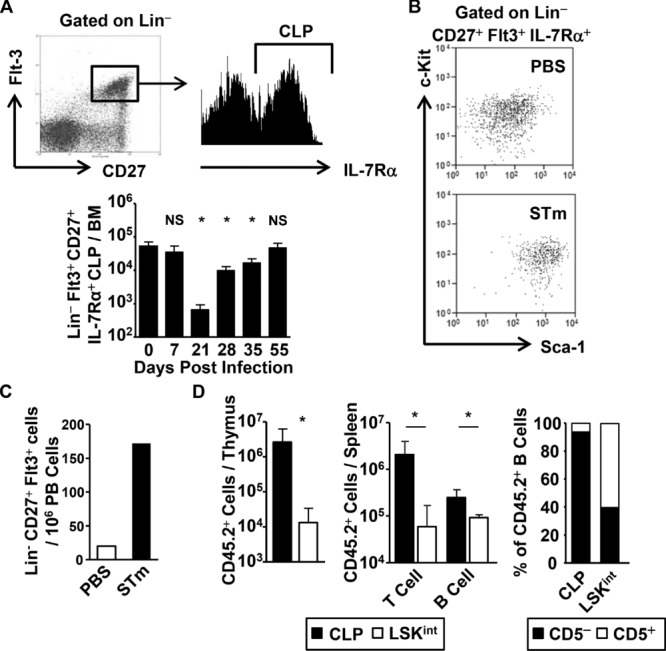
The generation of immune cells from BM precursors is a carefully regulated process. This is essential to limit the potential for oncogenesis and autoimmunity yet protect against infection. How infection modulates this is unclear. Salmonella can colonize systemic sites including the BM and spleen. This resolving infection has multiple IFN-γ-mediated acute and chronic effects on BM progenitors, and during the first week of infection IFN-γ is produced by myeloid, NK, NKT, CD4(+) T cells, and some lineage-negative cells. After infection, the phenotype of BM progenitors rapidly but reversibly alters, with a peak ∼ 30-fold increase in Sca-1(hi) progenitors and a corresponding loss of Sca-1(lo/int) subsets. Most strikingly, the capacity of donor Sca-1(hi) cells to reconstitute an irradiated host is reduced; the longer donor mice are exposed to infection, and Sca-1(hi) c-kit(int) cells have an increased potential to generate B1a-like cells. Thus, Salmonella can have a prolonged influence on BM progenitor functionality not directly related to bacterial persistence. These results reflect changes observed in leucopoiesis during aging and suggest that BM functionality can be modulated by life-long, periodic exposure to infection. Better understanding of this process could offer novel therapeutic opportunities to modulate BM functionality and promote healthy aging.

Keywords: Bacterial Infection; Bone Marrow; Leucopoiesis; Progenitor; Salmonella.


Figures

Figure 1
Figure 1
Infection with STm results in rapid BM colonization and a reduction in cellularity that recovers upon clearance of systemic bacterial burden. WT mice were immunized i.p. with 5 × 10⁵ STm, and bacterial burden in the spleen and BM of mice was quantified at key time-points during infection. The impact of colonization on splenic and BM homeostasis was quantified by measurement of changes to total cellularity in these tissues. Data are shown as mean + S.D. (n = 4) and are representative of at least three independent time-courses. *p ≤ 0.05 or nonsignificant (NS) compared to noninfected day 0 controls; two-tailed student's t-test.
Figure 2
Figure 2
STm infection and colonization of the BM results in rapid, reversible changes to progenitor populations. (A) BM from WT mice were collected at 0, 7, 21, 28, 35, and 55 days postSTm immunization and progenitor populations identified by flow cytometry as shown in the representative histograms and plots, using combinations of IL-7Rα, Sca-1, and c-Kit, and lack of expression of mature lineage (Lin) markers. (B) Graphs show the absolute number of identified progenitor populations in the total BM by flow cytometry. (C) C57BL/6 mice were challenged with 5 × 10⁵ STm either i.p. or i.v. for 7 days and BM progenitor subsets quantified as in (A). Data are shown as mean + S.D. (n = 4) and are representative of at least three independent time-courses in (B) and two independent experiments in (C). *p ≤ 0.05 or nonsignificant (NS) compared to noninfected day 0 controls in (B) or between groups in (C); two-tailed student's t-test.
Figure 3
Figure 3
The early BM response to Salmonella requires IFN-γ but is independent of TLR4. (A) WT, IFN-γ or TNF-R1, and R2 (TNFR−/−) deficient mice were challenged with PBS or STm for 7 days, and changes to BM progenitor population numbers were assessed by flow cytometry. (B) IFN-γ-EYFP reporter mice were challenged with 5 × 10⁵ STm for 1 or 7 days and EYFP expression in the Lin fraction analyzed by flow cytometry as shown in the representative plots. Top left graph shows the proportion of IFN-γ-EYFP expressing cells in the whole BM or Lin fraction. Cells producing IFN-γ were identified by flow cytometry in either the whole BM (right graph) or the Lin fraction (bottom left graph). (C) WT mice were challenged with 20 μg purified LPS i.p. and changes to BM progenitor numbers identified by flow cytometry at day 1 and 7 post-challenge. (D) WT or TLR4−/− mice were challenged with either STm or PBS for 7 days and changes to progenitor populations quantified by flow cytometry. (A–D) Data are shown as mean + S.D. (n = 4) and are representative of two independent experiments.*p ≤ 0.05 or nonsignificant (NS); two-tailed student's t-test.
Figure 4
Figure 4
Salmonella induced increase in BM LSK population occurs through expansion of distinct subsets and induced proliferation. (A) Representative histograms show the expression of CD25 on LSK cells from PBS or STm infected BM of WT mice. Graph shows the total numbers of CD25+ and CD25 LSK cells in the BM during a representative time-course of STm infection. (B) After 7 days postadministration of STm or PBS, actively proliferating BM progenitors were quantified by BrdU uptake and flow cytometry. (A and B) Data are shown as mean + S.D. (n = 4) and are representative of two independent (A) time-courses or (B) experiments. *p ≤ 0.05 or nonsignificant (NS) of LSKCD25+ compared to LSKCD25; #p ≤ 0.05 or NS of CD25 subset numbers compared to day 0; *p ≤ 0.05 or NS compared to PBS controls; two-tailed student's t-test.
Figure 5
Figure 5
Infection with STm drives the expansion of the LSK population and activation of LT-HSCs. (A) WT mice were infected with STm, and the BM LSK population was further subdivided by flow cytometry into LT-HSCs, ST-HSCs, and MPPs using the expression of CD34 and Flt3. Numbers in the top panels depict the LSK population as a proportion of the lineage negative fraction, and in brackets of the whole BM. In the lower panels, numbers depict the individual subsets as a proportion of the total LSK population. Graphs on right show the absolute numbers of these fractions in the BM during the time-course of infection. (B) Representative flow cytometry plots of CD150 and CD48 expression on LT-HSCs from WT mice immunized with PBS or STm for 7 days. Numbers depict the proportion of the subsets as a percentage of total LT-HSC cells. Graphs show the total number of each fraction identified in the BM. (C) After 7 days exposure to STm, the proportion of LT-HSC populations that were actively proliferating was quantified by BrdU uptake and flow cytometry. (A–C) Data are shown as mean + S.D. (n = 4) and (A and B) are representative of at least three independent time-courses or (C) two independent experiments. *p ≤ 0.05 or nonsignificant (NS) compared to day 0 noninfected or PBS controls; two-tailed student's t-test.
Figure 6
Figure 6
STm infection influences CLP phenotype and function. (A) Whole BM from WT mice were assessed by flow cytometry to identify LinCD27+Flt3+ progenitors, containing IL-7Rα+ CLPs as shown in the representative plots. Graph shows the total numbers of LinCD27+Flt3+IL-7Rα+ CLP progenitors in the BM during infection. (B) Representative flow cytometry plots showing the phenotypic distribution of LinCD27+Flt3+ CLPs using Sca-1 and c-Kit in BM of WT mice immunized with PBS or STm for 7 days. (C) Numbers of thymic settling progenitors in the peripheral blood of WT mice challenged with STm or PBS for 7 days were quantified by flow cytometry. Each bar represents the total number of cells found in the pooled blood from four mice and is representative of two individual experiments. (D) The reconstitution potential of 2 × 10³ purified CLPs or LSKint cells was assessed after transfer into lethally irradiated Rag1 deficient congenic hosts. Graphs show the total number of donor progeny in the thymus, and individual subsets found in the spleen. (A–D) Data are shown as mean + S.D. (n = 4) and are representative of (A and B) at least three independent experiments or (C and D) two. *p ≤ 0.05 or nonsignificant (NS) compared to day 0 noninfected controls; two-tailed student's t-test.
Figure 7
Figure 7
Systemic bacterial infection alters BM progenitor engraftment potential. (A) LSK or LSK cells were isolated from BM cells of WT donors exposed to infection for 7, 21, or 42 days, or noninfected (day 0) controls. Progenitors were transferred with unfractionated BM, and engraftment in irradiated congenic hosts was assessed by flow cytometry after 28 days. (B) Graphs show absolute numbers of CD45.2 progenitor progeny recovered from the spleen, thymus, and BM from LSK (black bars) or LSK (gray bars) donor cells. (C) The proportion of CD45.2+ BM progeny from LSK donors that reconstituted the host BM Lin compartment was assessed (left graph). The proportion of the CD45.2+Lin cells with an LSK or LSK phenotype was quantified (right graph). (D) Absolute numbers of mature progeny in the spleen derived from donor LSK cells exposed to infection for various periods of time in the spleen were evaluated by flow cytometry. (B–D) Data are shown as mean + S.D. (n = 4) and are representative of at least two independent experiments. In (B), *p ≤ 0.05 or nonsignificant (NS) between groups; p0.05 or #p ≤ 0.05 or NS compared to day 0 donor cells (two-tailed student's t-test). In (C and D) *p ≤ 0.05 or NS compared to day 0 donor cells (two-tailed student's t-test).

References

    1. Spangrude GJ, Heimfeld S, Weissman IL. Purification and characterization of mouse hematopoietic stem cells. Science. 1988;241:58–62. - PubMed
    1. Orford KW, Scadden DT. Deconstructing stem cell self-renewal: genetic insights into cell-cycle regulation. Nat. Rev. Genet. 2008;9:115–128. - PubMed
    1. Arai F, Suda T. Maintenance of quiescent hematopoietic stem cells in the osteoblastic niche. Ann. N. Y. Acad. Sci. 2007;1106:41–53. - PubMed
    1. MacNamara KC, Oduro K, Martin O, Jones DD, McLaughlin M, Choi K, Borjesson DL, et al. Infection-induced myelopoiesis during intracellular bacterial infection is critically dependent upon IFN-gamma signaling. J. Immunol. 2011;186:1032–1043. - PMC - PubMed
    1. Baldridge MT, King KY, Boles NC, Weksberg DC, Goodell MA. Quiescent haematopoietic stem cells are activated by IFN-gamma in response to chronic infection. Nature. 2010;465:793–797. - PMC - PubMed

Publication types

MeSH terms