

How to interpret a small increase in AUC with an additional risk prediction marker: decision analysis comes through
- PMID: 24825728
- PMCID: PMC4156533
- DOI: 10.1002/sim.6195
How to interpret a small increase in AUC with an additional risk prediction marker: decision analysis comes through
Erratum in
- Stat Med. 2014 Feb 28;34(5):900. Vickers, Andew [corrected to Vickers, Andrew]
- Stat Med. 2014 Sep 28;33(22)3960
Abstract
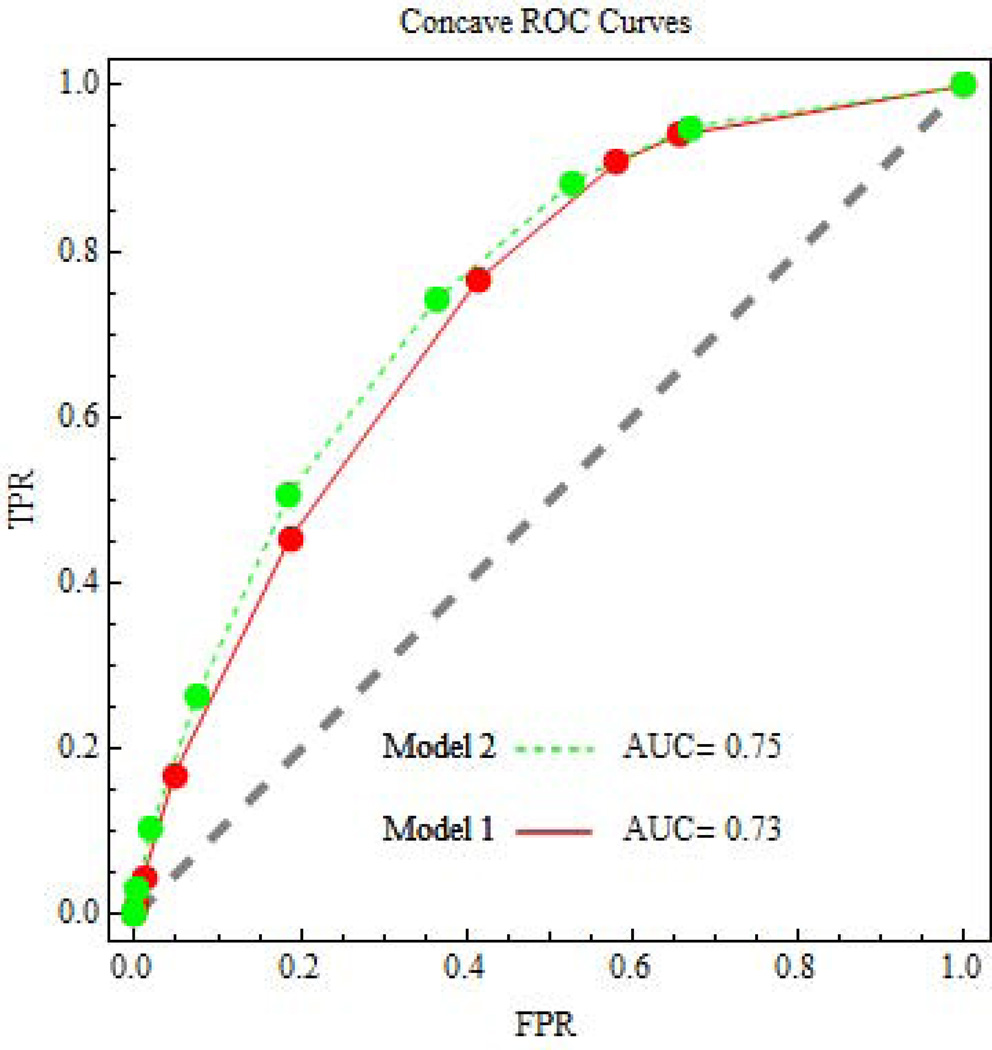
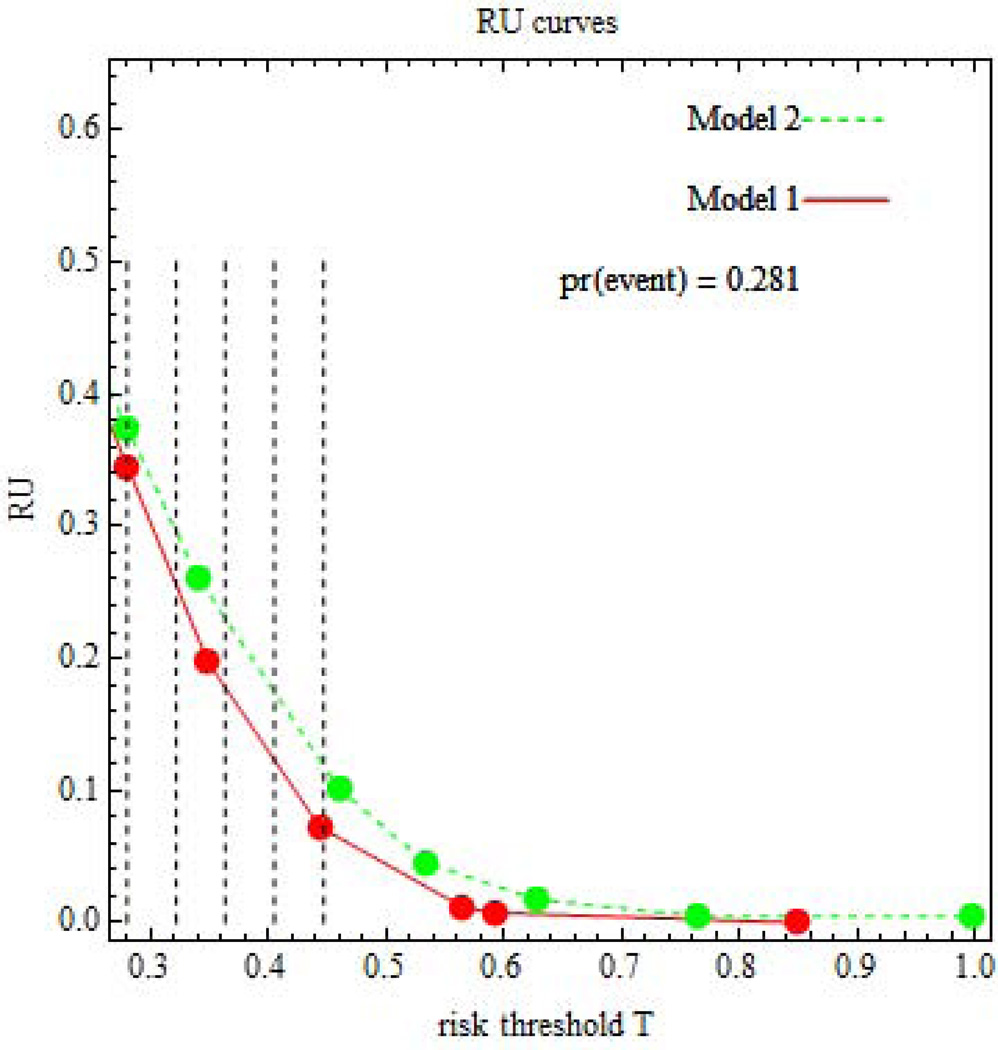
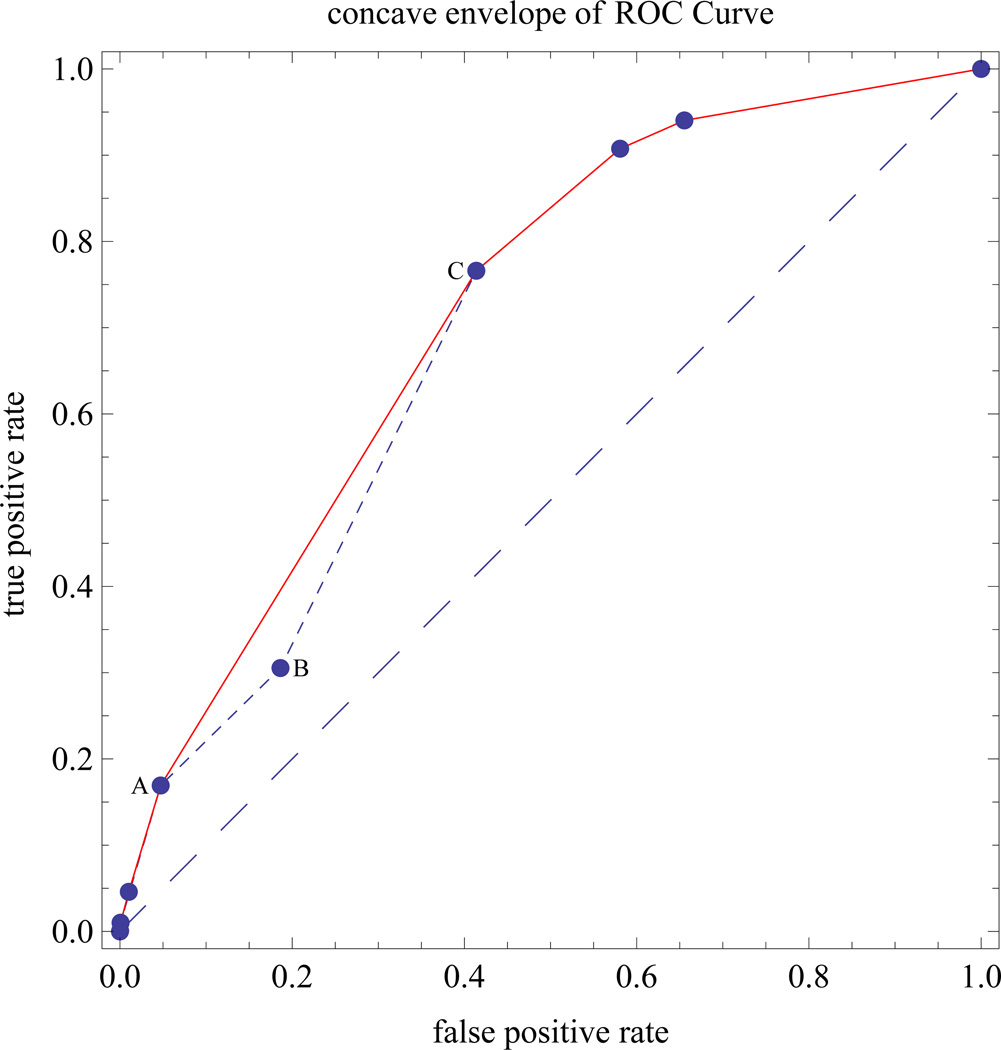
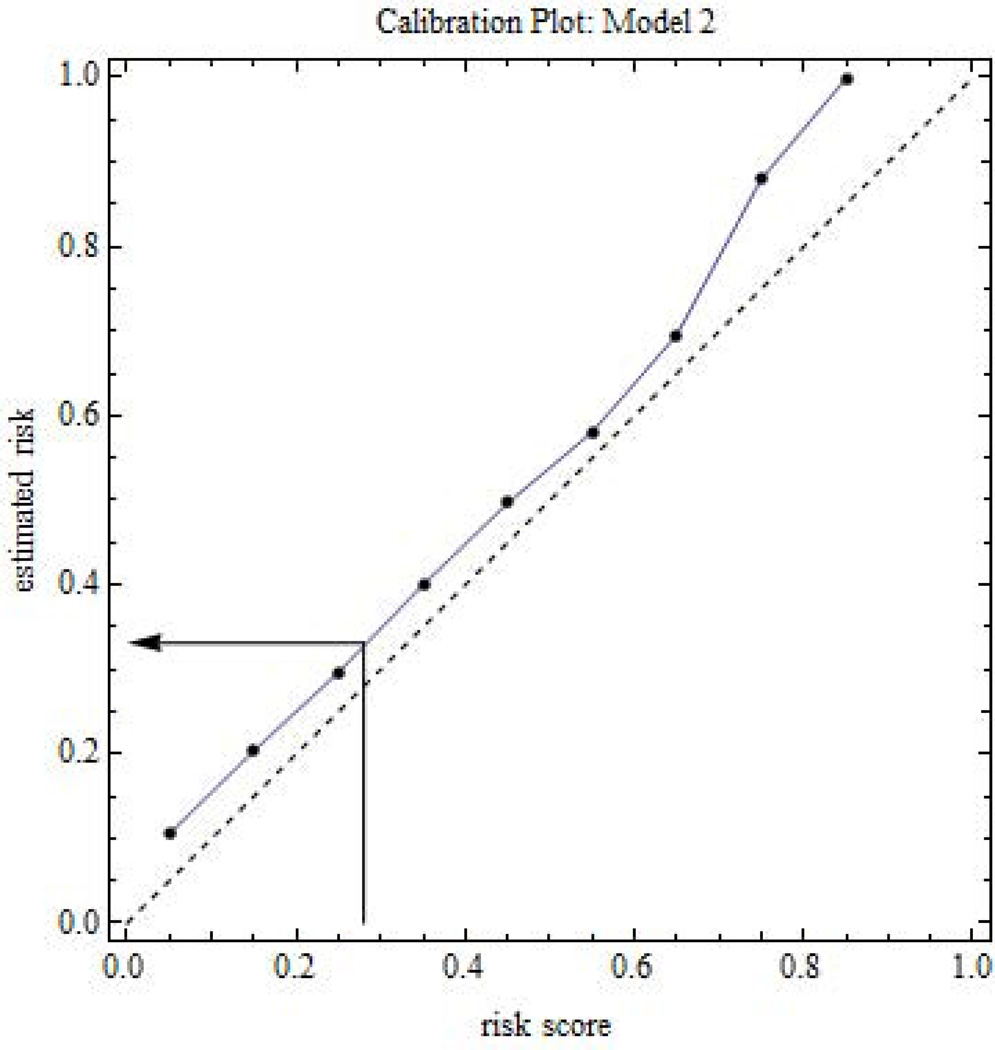
An important question in the evaluation of an additional risk prediction marker is how to interpret a small increase in the area under the receiver operating characteristic curve (AUC). Many researchers believe that a change in AUC is a poor metric because it increases only slightly with the addition of a marker with a large odds ratio. Because it is not possible on purely statistical grounds to choose between the odds ratio and AUC, we invoke decision analysis, which incorporates costs and benefits. For example, a timely estimate of the risk of later non-elective operative delivery can help a woman in labor decide if she wants an early elective cesarean section to avoid greater complications from possible later non-elective operative delivery. A basic risk prediction model for later non-elective operative delivery involves only antepartum markers. Because adding intrapartum markers to this risk prediction model increases AUC by 0.02, we questioned whether this small improvement is worthwhile. A key decision-analytic quantity is the risk threshold, here the risk of later non-elective operative delivery at which a patient would be indifferent between an early elective cesarean section and usual care. For a range of risk thresholds, we found that an increase in the net benefit of risk prediction requires collecting intrapartum marker data on 68 to 124 women for every correct prediction of later non-elective operative delivery. Because data collection is non-invasive, this test tradeoff of 68 to 124 is clinically acceptable, indicating the value of adding intrapartum markers to the risk prediction model.
Keywords: AUC; cesarean section; decision curves; receiver operating characteristic curves; relative utility curves.
Copyright © 2014 John Wiley & Sons, Ltd.
Figures
References
-
- Tzoulaki I, Liberopoulos G, Ioannidis JP. Assessment of claims of improved prediction beyond the Framingham risk score. Journal of the American Medical Association. 2009;302:2345–2352. - PubMed
-
- Schuit E, Kwee A, Westerhuis ME, Van Dessel HJ, Graziosi GC, Van Lith JM, Nijhuis JG, Oei SG, Oosterbaan HP, Schuitemaker NW, Wouters MG, Visser GH, Mol BW, Moons KG, Groenwold RH. A clinical prediction model to assess the risk of later non-elective operative delivery. BJOG : an International Journal of Obstetrics and Gynaecology. 2012;119:915–923. - PubMed
MeSH terms
Grants and funding
LinkOut - more resources
Full Text Sources
Other Literature Sources
Medical