Review
. 2014:13:10.2310/7290.2014.00015.
doi: 10.2310/7290.2014.00015.

Comparison of amino acid positron emission tomographic radiotracers for molecular imaging of primary and metastatic brain tumors

Review

Comparison of amino acid positron emission tomographic radiotracers for molecular imaging of primary and metastatic brain tumors

Csaba Juhász et al. Mol Imaging. 2014.

Abstract

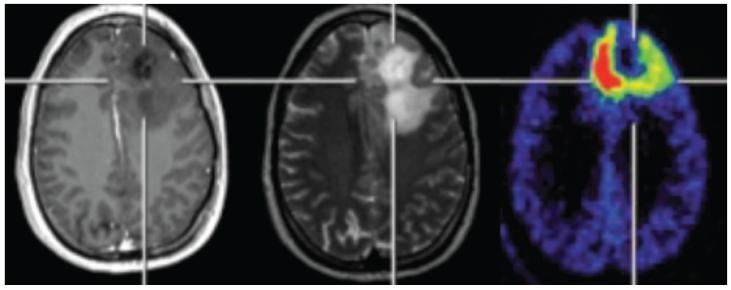
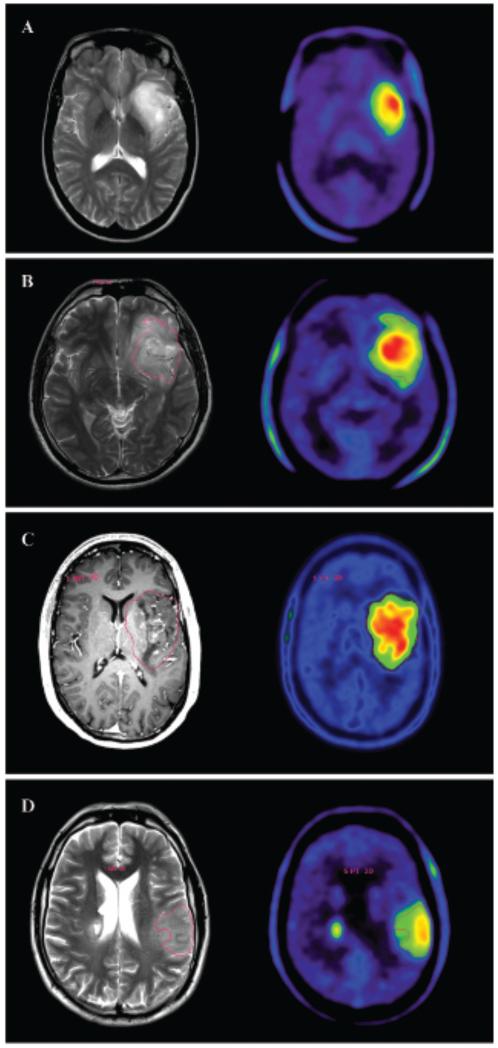
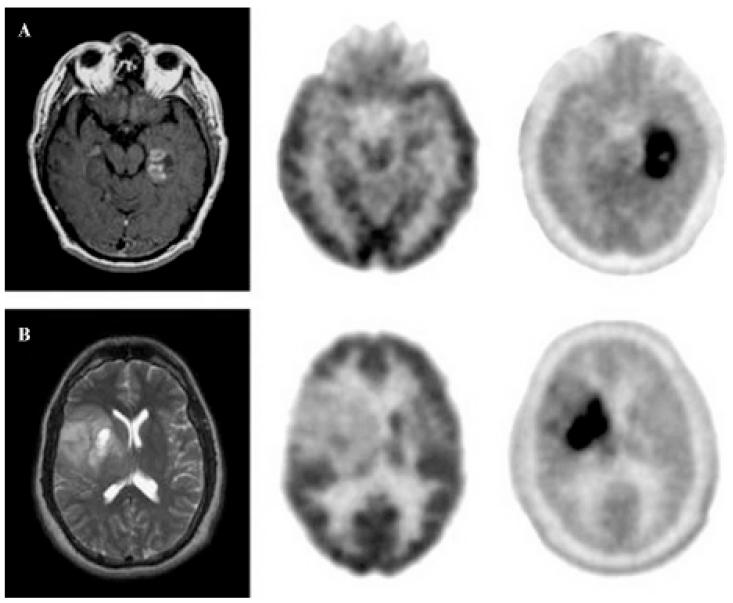
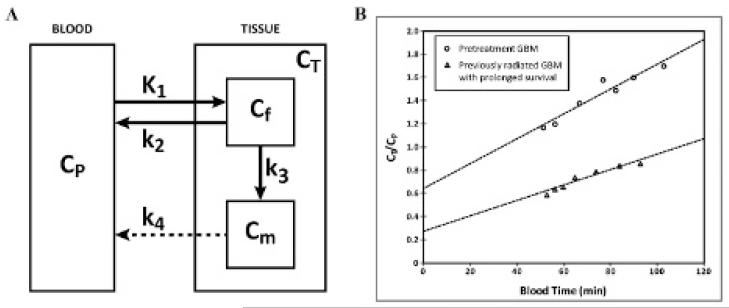
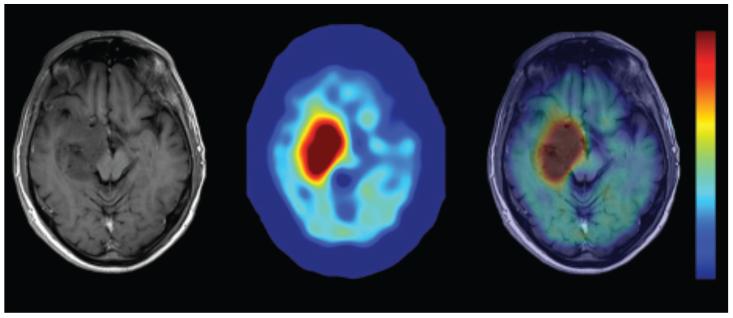
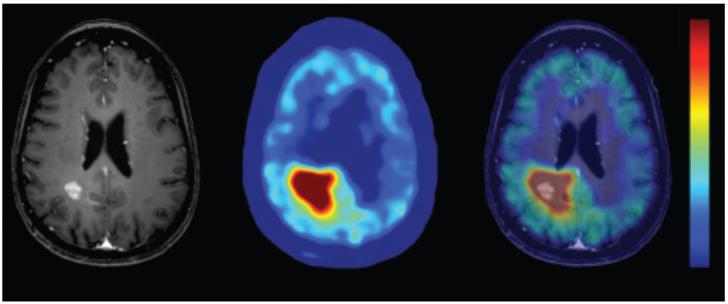
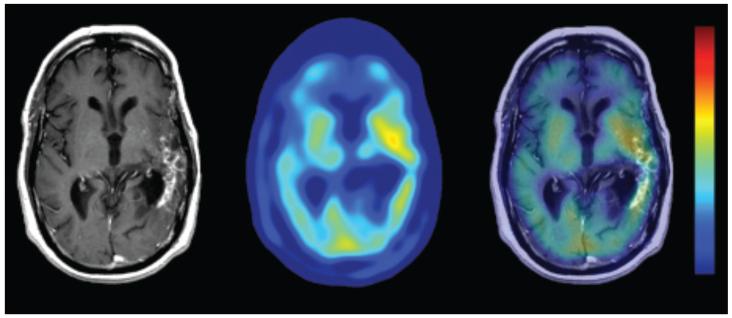
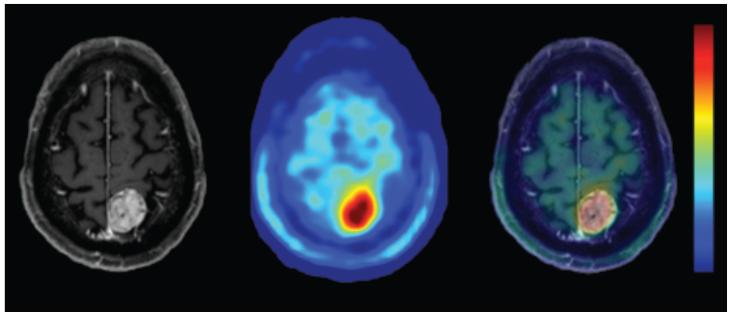
Positron emission tomography (PET) is an imaging technology that can detect and characterize tumors based on their molecular and biochemical properties, such as altered glucose, nucleoside, or amino acid metabolism. PET plays a significant role in the diagnosis, prognostication, and treatment of various cancers, including brain tumors. In this article, we compare uptake mechanisms and the clinical performance of the amino acid PET radiotracers (l-[methyl-11C]methionine [MET], 18F-fluoroethyl-tyrosine [FET], 18F-fluoro-l-dihydroxy-phenylalanine [FDOPA], and 11C-alpha-methyl-l-tryptophan [AMT]) most commonly used for brain tumor imaging. First, we discuss and compare the mechanisms of tumoral transport and accumulation, the basis of differential performance of these radioligands in clinical studies. Then we summarize studies that provided direct comparisons among these amino acid tracers and to clinically used 2-deoxy-2[18F]fluoro-d-glucose [FDG] PET imaging. We also discuss how tracer kinetic analysis can enhance the clinical information obtained from amino acid PET images. We discuss both similarities and differences in potential clinical value for each radioligand. This comparative review can guide which radiotracer to favor in future clinical trials aimed at defining the role of these molecular imaging modalities in the clinical management of brain tumor patients.


Figures

Figure 1
Figure 1
Coregistered T1-Gad (left), T2-weighted (middle), and MET-PET (right) images showing metabolically active tumor (glioblastoma) portions extending beyond the boundaries of the gadolinium-enhancing volume and partly extending beyond the high T2 signal. On the MET-PET image, blue/purple indicates low, whereas yellow to red indicates increased radiotracer uptake. Adapted from Galldiks N et al.
Figure 2
Figure 2
Coregistered magnetic resonance (left column, T2 weighted: A, B, D; T1-Gad: C) and FET-PET images (right column) of a newly diagnosed World Health Organization grade II astrocytoma (A), grade II oligodendroglioma (B), grade III anaplastic oligodendroglioma (C), and grade IV glioblastoma (D). On the FET-PET image, blue indicates low, whereas green to yellow to red indicates increasing radiotracer uptake. Note that both low- and high-grade gliomas show high FET uptake; tumor grades cannot be distinguished reliably based on static FET-PET images. Courtesy of Dr. Ian Law, Department of Clinical Physiology, Nuclear Medicine and PET, Rigshospitalet, Copenhagen University Hospital, Denmark.
Figure 3
Figure 3
Magnetic resonance (left column), FDG-PET (middle column), and FDOPA-PET (right column) images of a newly diagnosed glioblastoma (A) and a newly diagnosed World Health Organization grade II oligodendroglioma (B). Note that FDOPA uptake is elevated in both low- and high-grade gliomas. This research was originally published in JNM. Chen W, Silverman DH, Delaloye S, et al. 18F-FDOPA PET Imaging of Brain Tumors: Comparison Study with 18F-FDG PET and Evaluation of Diagnostic Accuracy. J Nucl Med. 2006;47(6):904-911. Figure 2. © by the Society of Nuclear Medicine and Molecular Imaging, Inc.
Figure 4
Figure 4
A, Tracer kinetic model for AMT. The inflow rate constant (K1) and the outflow rate constant (k2) describe the exchange of AMT between the plasma (CP) and the tissue (CT). CT includes the intracellular space (Cf) and the metabolite pool (Cm). In the intracellular space, a certain amount of AMT is enzymatically converted and enters the metabolite pool. The rate of this conversion is characterized by k3. The metabolite outflow rate (k4) is negligible in this model as the AMT metabolites are being trapped in the intracellular space, mainly in the form of 11C-alpha-methyl-l-kynurenine in tumors. B, The Patlak plots of two patients with a history of glioblastoma (GBM). The intercept of the curves represents the tracer volume of distribution (VD, which is proportional to the net tracer transport from the CP to CT), whereas the slope of the curves represents the estimated unidirectional AMT uptake (K complex). Note the higher slope and VD of the patient with pretreatment glioblastoma (see Figure 6) compared to the patient with previously radiated glioblastoma and prolonged survival, suggesting the presence of radiation necrosis in the magnetic resonance contrast-enhancing area in the latter patient (see Figure 7).
Figure 5
Figure 5
Contrast-enhanced magnetic resonance (left), AMT-PET (middle), and AMT/MRI fusion (right) images of a patient with a World Health Organization grade II glioma. The AMT-PET image is visualized using a rainbow scale, where red and yellow indicate increased and dark blue indicates decreased tracer uptake.
Figure 6
Figure 6
Contrast-enhanced magnetic resonance (left), AMT-PET (middle), and AMT/MRI fusion (right) images of a patient with pretreatment glioblastoma.
Figure 7
Figure 7
Contrast-enhanced magnetic resonance (left), AMT-PET (middle), and AMT/MRI fusion (right) images of a patient with previously radiated glioblastoma and prolonged survival. Low AMT SUV was associated with prolonged survival.
Figure 8
Figure 8
Contrast-enhanced magnetic resonance (left), AMT-PET (middle), and AMT/MRI fusion (right) images of a patient with a World Health Organization grade I meningioma.

Similar articles

Cited by

References

    1. Essig M, Anzalone N, Combs SE, et al. MR imaging of neoplastic central nervous system lesions: review and recommendations for current practice. AJNR Am J Neuroradiol. 2012;33:803–17. doi:10.3174/ajnr.A2640. - PMC - PubMed
    1. Weise G, Stoll G. Magnetic resonance imaging of blood brain/nerve barrier dysfunction and leukocyte infiltration: closely related or discordant? Front Neurol. 2012;3:178. doi:10.3389/fneur.2012.00178. - PMC - PubMed
    1. Reddy K, Westerly D, Chen C. MRI patterns of T1 enhancing radiation necrosis versus tumour recurrence in high-grade gliomas. J Med Imaging Radiat Oncol. 2013;57:349–55. doi:10.1111/j.1754-9485.2012.02472.x. - PubMed
    1. van den Bent MJ, Vogelbaum MA, Wen PY, et al. End point assessment in gliomas: novel treatments limit usefulness of classical Macdonald’s Criteria. J Clin Oncol. 2009;27:2905–8. doi:10.1200/JCO.2009.22.4998. - PMC - PubMed
    1. Hu LS, Baxter LC, Smith KA, et al. Relative cerebral blood volume values to differentiate high-grade glioma recurrence from posttreatment radiation effect: direct correlation between image-guided tissue histopathology and localized dynamic susceptibility-weighted contrast-enhanced perfusion MR imaging measurements. AJNR Am J Neuroradiol. 2009;30:552–8. doi:10.3174/ajnr.A1377. - PMC - PubMed

Publication types

LinkOut - more resources