. 2014 Sep 4;124(10):1659-68.
doi: 10.1182/blood-2013-10-528737. Epub 2014 May 13.

Suppression of inhibitor formation against FVIII in a murine model of hemophilia A by oral delivery of antigens bioencapsulated in plant cells

Affiliations

Suppression of inhibitor formation against FVIII in a murine model of hemophilia A by oral delivery of antigens bioencapsulated in plant cells

Alexandra Sherman et al. Blood. .

Abstract

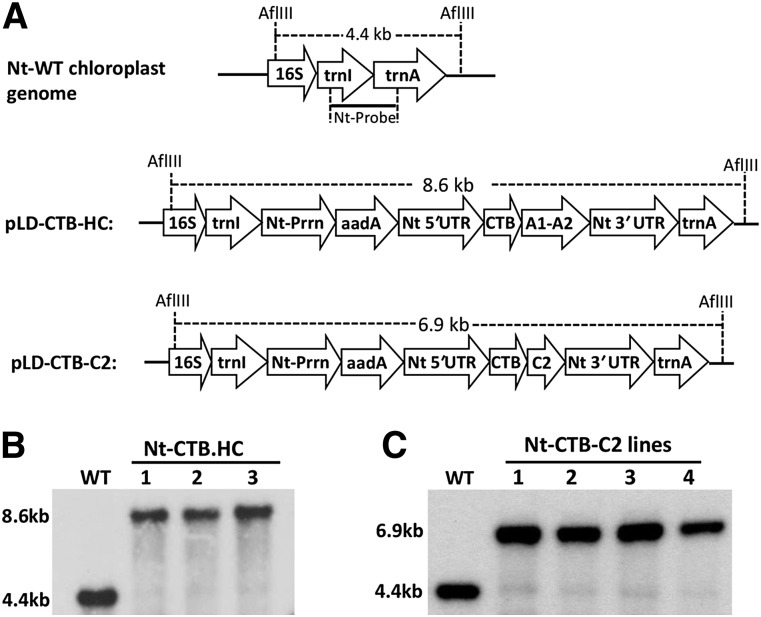
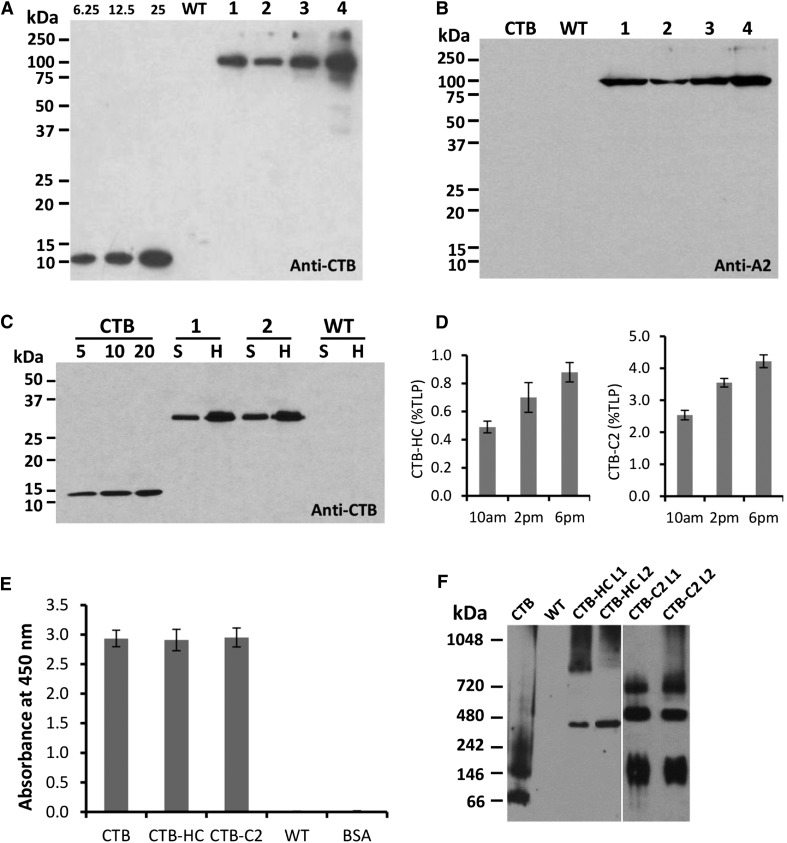
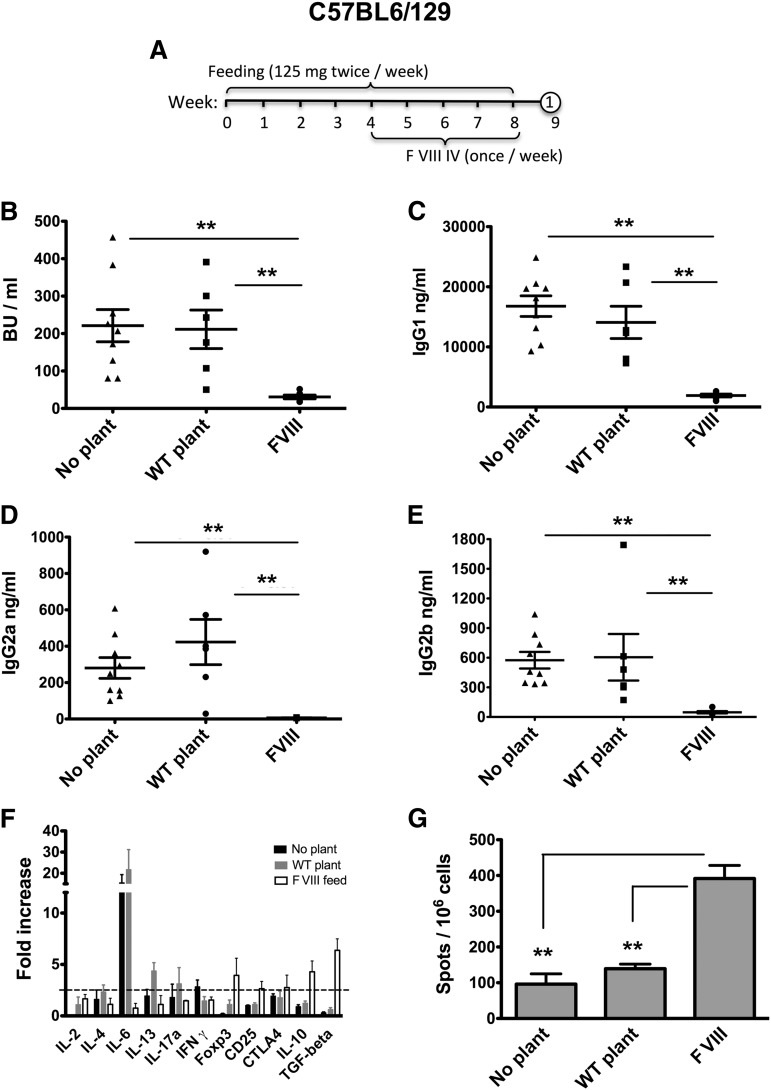
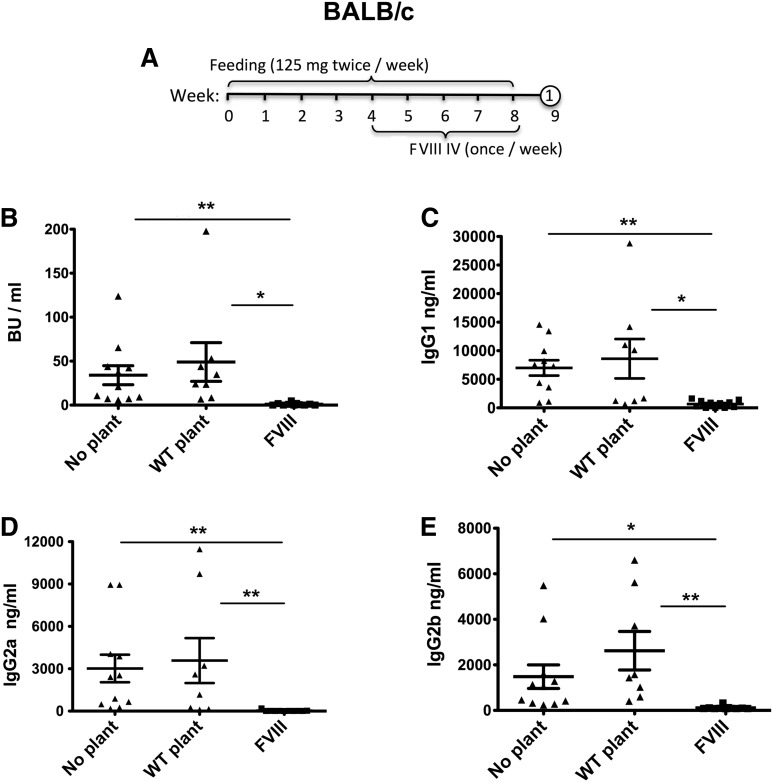
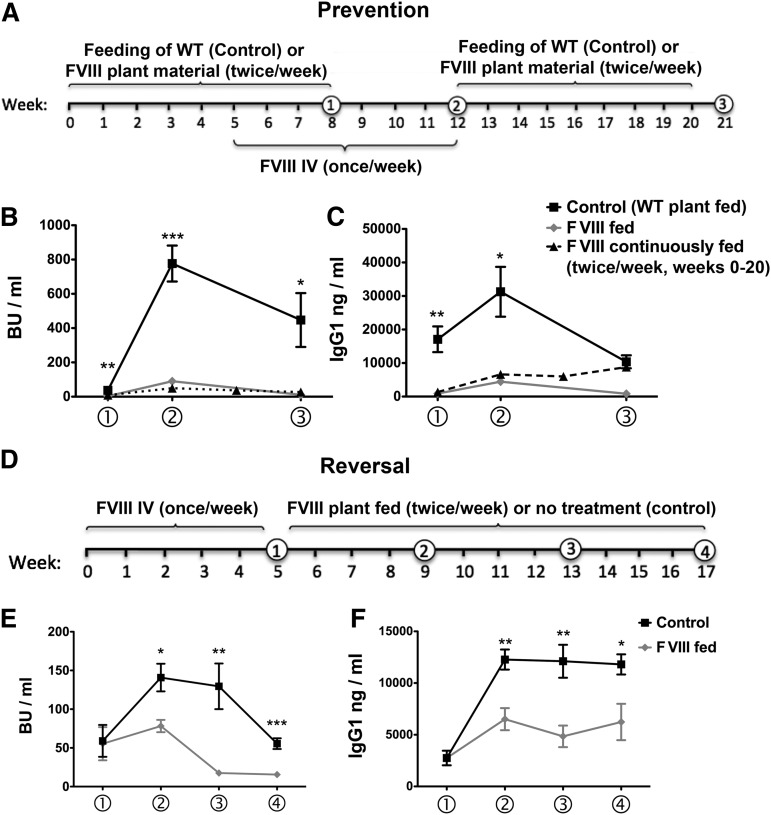
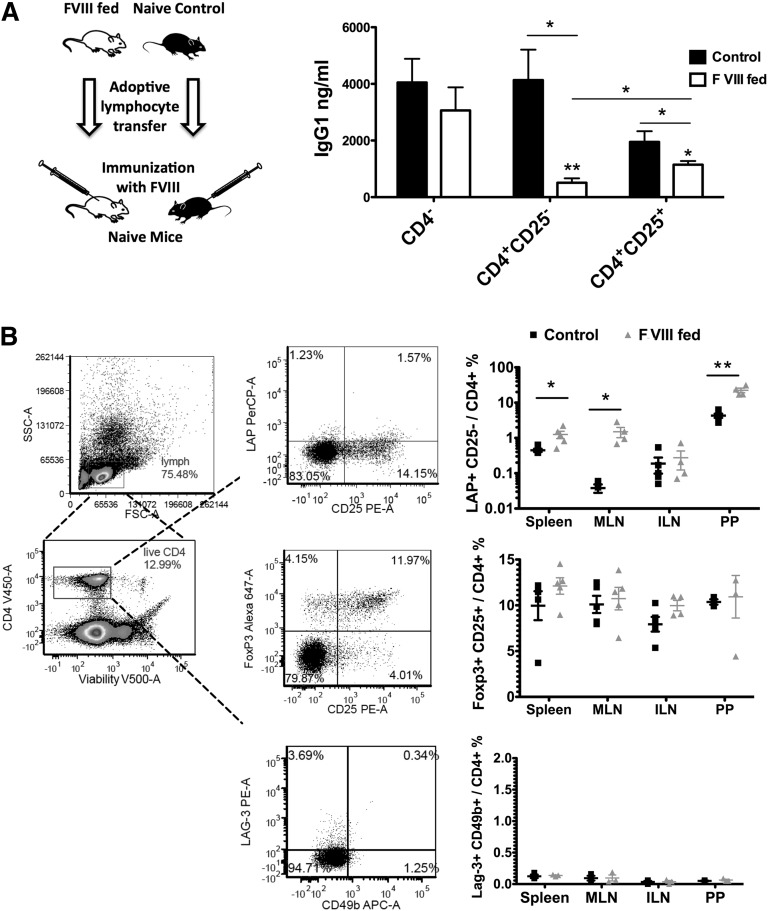
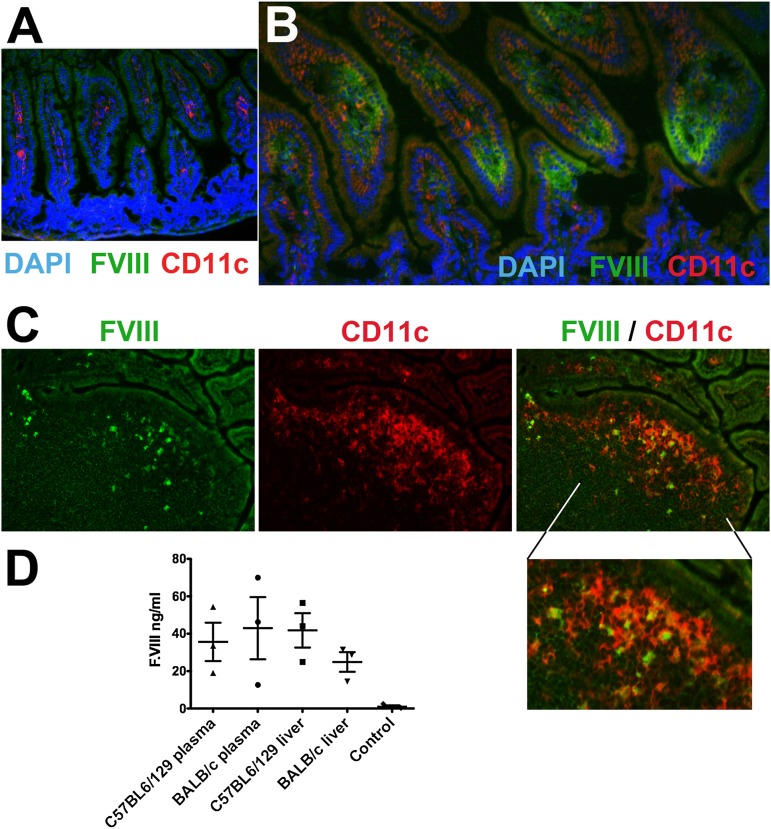
Hemophilia A is the X-linked bleeding disorder caused by deficiency of coagulation factor VIII (FVIII). To address serious complications of inhibitory antibody formation in current replacement therapy, we created tobacco transplastomic lines expressing FVIII antigens, heavy chain (HC) and C2, fused with the transmucosal carrier, cholera toxin B subunit. Cholera toxin B-HC and cholera toxin B-C2 fusion proteins expressed up to 80 or 370 µg/g in fresh leaves, assembled into pentameric forms, and bound to GM1 receptors. Protection of FVIII antigen through bioencapsulation in plant cells and oral delivery to the gut immune system was confirmed by immunostaining. Feeding of HC/C2 mixture substantially suppressed T helper cell responses and inhibitor formation against FVIII in mice of 2 different strain backgrounds with hemophilia A. Prolonged oral delivery was required to control inhibitor formation long-term. Substantial reduction of inhibitor titers in preimmune mice demonstrated that the protocol could also reverse inhibitor formation. Gene expression and flow cytometry analyses showed upregulation of immune suppressive cytokines (transforming growth factor β and interleukin 10). Adoptive transfer experiments confirmed an active suppression mechanism and revealed induction of CD4(+)CD25(+) and CD4(+)CD25(-) T cells that potently suppressed anti-FVIII formation. In sum, these data support plant cell-based oral tolerance for suppression of inhibitor formation against FVIII.


Figures

Figure 1
Figure 1
Chloroplast transformation vectors and integration of transgenes into the chloroplast genome. (A) Tobacco chloroplast expression vectors. Homologous chloroplast genome flanking sequences comprising 16S (16S rRNA), isoleucine tRNA (trnI), alanine tRNA (trnA) gene sequences. In both vectors, a glycine-proline-glycine-proline hinge and furin cleavage site (RRKR) is included between CTB and the FVIII domain sequence. The restriction site of AflIII and the sizes of Southern blot fragments are indicated. (B) Southern blot, tobacco CTB-HC, wild-type (WT) (untransformed), 1-3 transplastomic lines. Tobacco total genomic DNA was digested with AflIII and probed with 0.81 kb trnI/trnA flanking region fragment. (C) Southern blot, tobacco CTB-C2, WT (untransformed WT), 1-4 transplastomic lines. 3′ UTR, 3′ UTR of tobacco psbA gene; 5′ UTR, promoter and 5′ UTR of tobacco psbA gene; aadA, aminoglycoside 3′-adenylyltransferase gene to confer spectinomycin resistance; Nt, Nicotiana tabacum. Prrn, ribosomal RNA operon promoter with GGAG ribosome binding site; WT, untransformed WT.
Figure 2
Figure 2
Characterization of CTB-HC and CTB-C2 expression in tobacco chloroplasts. (A) Detection of heavy chain fusion protein probed with the CTB antibody. CTB standard, 6.25, 12.5, and 25 ng. Lanes 1 to 4 indicate transplastomic lines. Five micrograms total protein of homogenate fraction per lane was loaded. (B) Detection of heavy chain probed with the A2 antibody. CTB, 25 ng. 1-4, transplastomic lines. Five micrograms total protein of homogenate fraction per lane was loaded. (C) Detection of C2 fusion protein probed with the CTB antibody. CTB standard, 5, 10, and 20 ng. Two micrograms total protein of supernatant or homogenate fraction per lane was loaded. (D) Quantitation of CTB-HC and CTB-C2 expression in tobacco chloroplasts. Proteins were extracted from mature leaves at different time points on the same day. TLP, total leaf protein. (E) Ganglioside GM1 ELISA binding assay. CTB standard (0.1 ng), tobacco CTB-HC (5 µg); tobacco CTB-C2 (1 µg); untransformed tobacco WT (5 µg); BSA, bovine serum albumin (5 µg). (F) Blue native gel electrophoresis and western blot analysis to evaluate pentamer assembly. Pentamer sizes: CTB, 57.5 kDa; CTB-C2: 155 kDa; CTB-HC, 490 kDa. Samples loaded: CTB standard, 100 ng; WT, 40 µg; CTB-HC, 40 µg; CTB-C2, 10 µg. A vertical line is inserted between CTB-HC and CTB-C2 lanes to separate these 2 different blots. H, homogenate fraction; S, supernatant fraction; WT, untransformed WT.
Figure 3
Figure 3
Suppression of inhibitor formation against FVIII in C57BL6/129 mice with hemophilia A by oral administration of a 1:1 mixture of bioencapsulated CTB-C2 and CTB-HC FVIII antigens. (A) Time line of oral antigen administration and intravenous treatment with BDD-FVIII. Number in circle indicates time-point for tail bleed. (B) Inhibitor titers (in BU per milliliter) after 4 weekly IV injections of FVIII in non-fed animals (“no plant”) or mice fed with WT or FVIII containing plant material. IgG1 (C), IgG2a (D), IgG2b (E) titers against FVIII for the same experimental groups. (B-E) Data are shown for individual mice and as averages ± standard error of the mean (SEM). (F) After the blood draw, mice were killed and spleens collected. Splenocyte cultures for individual mice (n = 3-5 per group) were stimulated in vitro with 10 μg/mL BDD-FVIII for 48 hours. Subsequently, cells were harvested and subjected to quantitative reverse-transcription-PCR analysis. “Fold increase” is change in RNA transcripts of FVIII vs mock-stimulated cultures. The dotted horizontal line indicates the minimally required increase of 2.5-fold for a statistically significant difference. (G) Splenocytes derived from the same experimental mice were subjected to enzyme-linked immunospot analysis for frequency of IL-10 secreting cell population. All data are shown for individual mice and as averages ± SEM. Unpaired 2-tailed Student t tests were used to calculate P values (**P < .01).
Figure 4
Figure 4
Suppression of inhibitor formation against FVIII in BALB/c mice with hemophilia A by oral administration of a 1:1 mixture of bioencapsulated CTB-C2 and CTB-HC FVIII antigens. (A) Feeding and FVIII treatment schedule. Number in circle indicates time point for tail bleed. (B) Inhibitor titers (in BU per milliliter) after 4 weekly IV injections of BDD-FVIII in No plant, WT plant, and FVIII plant fed groups. IgG1 (C), IgG2a (D), and IgG2b (E) titers against FVIII for the same experimental groups. All data are shown for individual mice and as averages ± SEM. Unpaired 2-tailed Student t tests were used to calculate P values (*P < .05, ** P < .01).
Figure 5
Figure 5
Long-term control and reversal of inhibitor formation in BALB/c mice with hemophilia A. (A) Feeding (HC and C2 material) and FVIII administration schedule for prevention of inhibitor formation. Numbers in circles indicate time-points for blood collection. Inhibitor titers in BU per milliliter (B) and IgG1 titers against FVIII (C) at weeks 8, 12, and 21 of the experiment for FVIII-fed mice (n = 5, back square symbols) are compared with control mice (which were fed with WT plant material; n = 7; gray diamonds). Statistically significant differences between these groups for specific time points are indicated (*P < .05; **P < .01; ***P < .001, as calculated by unpaired 2-tailed Student t-test; data are averages ± SEM). A third group of mice (n = 7) was also fed with FVIII material, and FVIII was administered IV once/week starting 1 month after initiation of the oral tolerance regimen. However, FVIII feeding and treatment were continued for the remaining duration of the experiment (ie, 20 weeks of FVIII feeding; these mice are labeled as “FVIII continuously fed” and graphed with black triangle symbols and dotted line in B and C; data are averages ± SEM). (D) FVIII administration and feeding schedule for reversal of inhibitor formation. Inhibitor formation was induced by repeated weekly IV injections of FVIII as indicated. Mice were divided into 2 groups with similar average inhibitor titers. Control mice (n = 5) did not receive any further treatment. The second group (“FVIII fed”; n = 4) was fed with FVIII plant material twice per week for the following 3 months. Inhibitor titers in BU per milliliter (E) and IgG1 titers against FVIII (F) are graphed for weeks 5, 9, 13, and 17 of the experiment, as explained earlier.
Figure 6
Figure 6
Active suppression of antibody formation against FVIII by induction of regulatory T cells. (A) Adoptive transfer experiments. CD4, CD4+CD25, and CD4+CD25+ cells were purified via magnetic sorting from spleens and MLN of FVIII-fed mice (n = 3) at time-point 3 indicated in Figure 5A and pooled (with a final ratio of approximately 30% spleen and 70% MLN-derived CD4+ T cells). Cells (106 per mouse) were adoptively transferred into naive BALB/c mice via tail vein injection. Control cells were from unchallenged naive mice of the same strain. Twenty-four hours later, all recipient mice (n = 5 per group) were challenged with 1 IU FVIII in adjuvant via subcutaneous injection. IgG titers against FVIII were determined 3 weeks later. All data are shown as averages ± SEM (*P < .05; **P < .01). (B) Frequencies of Treg subsets in FVIII fed and control BALB/c mice with hemophilia A. Cells derived from spleens, MLN, inguinal lymph nodes (ILN), and Peyer’s patches (PP) were isolated from mice that had either been fed with FVIII (HC+C2, “FVIII fed”) or WT plant material (“control”), followed by IV treatment with FVIII (“FVIII fed”). Stained cells were first gated for live CD4+ cells (positive CD4-eFluor 450 and negative viability dye eFluor 506 staining). The frequencies of CD4+CD25 Latency Associated Peptide (LAP)+ cells, CD4+CD25+Foxp3+ cells, and type 1 regulatory T cells (CD4+LAG-3+CD49b+) were calculated using flow cytometric analysis. Data for individual animals as well as averages ± SEM are shown (n = 3-5/group). Unpaired 2-tailed Student t tests were used to calculate P values for all panels.
Figure 7
Figure 7
Delivery of FVIII antigen to the GALT and into circulation. (A-C) Immunostains (original magnification, ×200) of ileum cryosections from unfed (A, negative control) or CTB-C2-fed (B, lamina propria; C, Peyer’s patch) BALB/c mice with hemophilia A. Stains are for C2 domain of FVIII (green), CD11c (red), and nuclei (DAPI; blue). (D) Human FVIII antigen levels were measured in plasma or liver protein extract of the CTB-HC-fed C57BL6/129 and BALB/c mice with hemophilia A and WT-fed control mice of the same strain, using HC-specific ELISA. All data are shown for individual mice and as averages ± SEM.

Comment in

Similar articles

Cited by

References

    1. Berntorp E, Shapiro AD. Modern haemophilia care. Lancet. 2012;379(9824):1447–1456. - PubMed
    1. Graw J, Brackmann HH, Oldenburg J, Schneppenheim R, Spannagl M, Schwaab R. Haemophilia A: from mutation analysis to new therapies. Nat Rev Genet. 2005;6(6):488–501. - PubMed
    1. Jayandharan GR, Srivastava A. Hemophilia: disease, diagnosis and treatment. J Genet Syndr Gene Ther. 2011:S1:005. - PMC - PubMed
    1. DiMichele DM. Immune tolerance in haemophilia: the long journey to the fork in the road. Br J Haematol. 2012;159(2):123–134. - PubMed
    1. Ehrenforth S, Kreuz W, Scharrer I, et al. Incidence of development of factor VIII and factor IX inhibitors in haemophiliacs. Lancet. 1992;339(8793):594–598. - PubMed

Publication types

MeSH terms