. 2014 Jul 11;289(28):19823-38.
doi: 10.1074/jbc.M114.548446. Epub 2014 May 13.

Transcriptional regulation of oncogenic protein kinase Cϵ (PKCϵ) by STAT1 and Sp1 proteins

Affiliations

Transcriptional regulation of oncogenic protein kinase Cϵ (PKCϵ) by STAT1 and Sp1 proteins

HongBin Wang et al. J Biol Chem. .

Abstract

Overexpression of PKCϵ, a kinase associated with tumor aggressiveness and widely implicated in malignant transformation and metastasis, is a hallmark of multiple cancers, including mammary, prostate, and lung cancer. To characterize the mechanisms that control PKCϵ expression and its up-regulation in cancer, we cloned an ∼ 1.6-kb promoter segment of the human PKCϵ gene (PRKCE) that displays elevated transcriptional activity in cancer cells. A comprehensive deletional analysis established two regions rich in Sp1 and STAT1 sites located between -777 and -105 bp (region A) and -921 and -796 bp (region B), respectively, as responsible for the high transcriptional activity observed in cancer cells. A more detailed mutagenesis analysis followed by EMSA and ChIP identified Sp1 sites in positions -668/-659 and -269/-247 as well as STAT1 sites in positions -880/-869 and -793/-782 as the elements responsible for elevated promoter activity in breast cancer cells relative to normal mammary epithelial cells. RNAi silencing of Sp1 and STAT1 in breast cancer cells reduced PKCϵ mRNA and protein expression, as well as PRKCE promoter activity. Moreover, a strong correlation was found between PKCϵ and phospho-Ser-727 (active) STAT1 levels in breast cancer cells. Our results may have significant implications for the development of approaches to target PKCϵ and its effectors in cancer therapeutics.

Keywords: Breast Cancer; Diacylglycerol; Gene Expression; Protein Kinase; Protein Kinase C (PKCϵ); STAT Transcription Factor; Signal Transduction; Specificity Protein 1 (Sp1); Transcription Promoter.


Figures

FIGURE 1.
FIGURE 1.
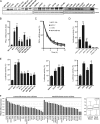
Elevated PKCϵ expression and PRKCE promoter activity in breast cancer cells. A, PKCϵ expression in immortalized “normal” MCF-10A mammary epithelial cells, RWPE-1 prostate epithelial cells, and HBEC lung epithelial cells, as well as in breast, prostate, and lung cancer cell lines, as determined by Western blot. Similar results were observed in three independent experiments. B, PKCϵ mRNA levels in mammary cell lines, as determined by qPCR. Data are expressed as mean ± S.E. of three independent experiments. *, p < 0.05; **, p < 0.01 versus MCF-10A cells. C, PKCϵ mRNA stability in MCF-10A, MCF-7, T-47D, and MDA-MB-453 cell lines. Cells were treated with actinomycin D (2.5 μg/ml), and RNA was extracted at different times. PKCϵ mRNA levels were measured by qPCR. Data are expressed as percentage relative to levels at t = 0 and represent the mean ± S.E. of three independent experiments. D, analysis of PRKCE promoter activity. Luciferase reporter plasmids pGL3−1933/+219, pGL3−1416/+219, pGL3−808/+219, pGL3−320/+219, pGL3−105/+219, and pGL3 empty vector were transfected into MCF-7 cells along with the pRL-TK Renilla luciferase vector. Luciferase activity was determined 48 h later. Data are expressed as mean ± S.E. of three independent experiments. *, p < 0.05; **, p < 0.01 versus pGL3 vector. E, luciferase activity in normal and cancer cells was determined 48 h after transfection of different cell lines with pGL3−1416/+219 along with the pRL-TK Renilla luciferase vector. Data are expressed as mean ± S.E. of three independent experiments. *, p < 0.05; **, p < 0.01 versus nontumorigenic cells. F, PKCϵ expression profile based on a compiled dataset of breast cancer cell lines (BCCLs) (left panel), which show no significant statistical differences between those of luminal and basal origin (p = 0.673) (right panel).
FIGURE 2.
FIGURE 2.
Methylation of PRKCE promoter is not associated with low PKCϵ mRNA levels in MCF-10A cells. A, identification of CpG islands in the PRKCE promoter with the Methyl Primer Express software (Applied BioSystems). B, MCF-10A cells were treated with different concentrations of AZA (1–100 μm, 96 h or 1 week), trichostatin A (TSA, 100 ng/ml, 24 h), or a combination of both drugs. At the end of the treatment, total RNA was isolated, and PKCϵ mRNA levels were determined by qPCR. For comparison, PKCϵ mRNA levels were also measured in T-47D cells. Data are expressed as fold-change relative to levels in T-47D cells (mean ± S.D., n = 3). Similar results were observed in two independent experiments.
FIGURE 3.
FIGURE 3.
Deletional analysis of the human PRKCE promoter. MCF-7 cells were co-transfected with pGL3 vectors coding different PKCϵ promoter fragments generated with the Erase-a-Base kit (Promega) and pRL-TK plasmid. Luciferase activity was measured 48 h later. Data are expressed as mean ± S.D. of triplicate samples. Two additional experiments gave similar results.
FIGURE 4.
FIGURE 4.
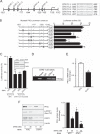
Sp1 elements in region A of the PRKCE promoter control its transcriptional activity. A, schematic representation of putative Sp1 sites (black boxes) in the PRKCE gene promoter. Seven putative Sp1-binding sites (Sp1-1 through Sp1-7) were identified (left panel). The corresponding sequences are shown (right panel). TSS, putative transcription starting site; ATG, start codon. B, deletional analysis of region A. Luciferase (Luc) activity of truncated constructs was determined 48 h after transfection into MCF-7 cells. Data are expressed as mean ± S.D. of triplicate samples. Two additional experiments gave similar results. *, p < 0.05; **, p < 0.01 versus control vector. C, schematic representation of mutated PRKCE promoter reporter constructs. The nonmutated Sp1 sites are indicated with black square boxes, and the mutated sites are marked with X on the black box. Luciferase activity of truncated constructs was determined 48 h after transfection into MCF-7 cells. Data are expressed as mean ± S.D. of triplicate samples. Two additional experiments gave similar results. *, p < 0.05 versus wild-type vector. D, MCF-7 cells were transfected with pGL3−777/+219 or pGL3−320/+219 reporter vectors and 24 h later treated with the Sp1 inhibitor mithramycin A (MTM, 100 nm) or vehicle for 16 h. Data are expressed as mean ± S.D. of triplicate samples. Two additional experiments gave similar results. *, p < 0.05, **, p < 0.01 versus control. E, ChIP assay. Upper panel, ChIP assay for Sp1-2 sites (fragment comprising bp −668/−659). Middle panel, ChIP assay for Sp1-5 site (fragment comprising bp −347/−338). Lower panel, ChIP assay for Sp1-6/7 sites (fragment comprising bp −269/−260 and bp −256/−247). F, MCF-7, T-47D, MDA-MB-231, and BT-474 cells were transiently transfected with Sp1 or nontarget control (NTC) RNAi duplexes. PKCϵ expression was determined by Western blot after 72 h. G, PKCϵ mRNA expression was determined by qPCR 72 h after transfection with either Sp1 or nontarget control RNAi duplexes. Data are expressed as fold-change relative to nontarget control and represent the mean ± S.D. of triplicate samples. *, p < 0.05 versus control. Similar results were observed in two independent experiments.
FIGURE 5.
FIGURE 5.
STAT1 elements in region B of the PRKCE promoter control its transcriptional activity. A, schematic representation of putative STAT1 sites (gray ovals) in the PRKCE gene promoter. Five putative STAT1-binding sites (STAT1-1 through STAT1-5) were identified (left panel). The corresponding sequences are shown (right panel). TSS, putative transcription starting site. ATG, start codon. B, schematic representation of mutated PKCϵ promoter reporter constructs. The nonmutated STAT1 sites are indicated with gray ovals, and the mutated sites are marked with X on the gray oval. Luciferase (Luc) activity of mutated constructs was determined 48 h after transfection into MCF-7 cells. Data are expressed as mean ± S.D. of triplicate samples. Two additional experiments gave similar results. *, p < 0.05; **, p < 0.01 versus pGL3−921/+219 (WT). C, STAT1 RNAi depletion inhibits luciferase activity of wild-type pGL3−921/+219 but not pGL3−921/219 (STAT1 2/3 mutated) construct. MCF-7 cells were transiently transfected with STAT1 or nontarget control (NTC) RNAi duplexes. Luciferase activity was determined 48 h after transfection of luciferase reporters. Inset, STAT1 expression as determined by Western blot. Data are expressed as mean ± S.D. of triplicate samples. Two additional experiments gave similar results. *, p < 0.05; **, p < 0.01 versus pGL3−921/+219 (WT). D, ChIP assay for STAT1-2 and STAT1-3 sites (fragment comprising bp −880/−869 and bp −793/−782). E, PKCϵ mRNA expression was determined by qPCR 72 h after transfection with either STAT1 or nontarget control RNAi duplexes. Data are expressed as fold-change relative to nontarget control and represent the mean ± S.D. of triplicate samples. *, p < 0.05 versus control. Similar results were observed in two independent experiments. F, effect of combined STAT1 RNAi depletion and treatment with the Sp1 inhibitor MTM (30 nm for 48 h). PKCϵ expression was determined by Western blot 72 h after RNAi duplex transfection (left panel). A densitometric analysis of four individual experiments is also shown (right panel). Results, normalized to control (NTC, no MTM treatment) are expressed as mean ± S.E. *, p < 0.05; **, p < 0.01 versus control.
FIGURE 6.
FIGURE 6.
Contribution of STAT1-2 and STAT1-3 sites to PKCϵ overexpression in breast cancer cells. A, cells were co-transfected with the indicated constructs together with the pRL-TK Renilla luciferase plasmid. Luciferase activity was determined 48 h after transfection. Data are expressed as the mean ± S.E. of three independent experiments. B, deletion of region comprising sites STAT-2 and STAT-3 decreases PKCϵ promoter activity in MCF-7 breast cancer cells but not in MCF-10A cells. Luciferase activities of constructs pGL3−912/+219 and pGL3−777/+219 were determined 48 h after transfection. Data are expressed as mean ± S.E. of three individual experiments. Activity of pGL3−921/+219 was set as 1. **, p < 0.01 versus pGL3−921/+219. C, mutation of STAT-2 and STAT-3 sites reduces PKCϵ promoter activity in MCF-7 breast cancer cells but not in MCF-10A cells, as determined 48 h after transfection of indicated plasmids. Data are expressed as mean ± S.E. of three individual experiments. Luciferase activity of wild-type pGL3−921/+219 was set as 1. **, p < 0.01 versus pGL3−921/+219 (WT). D, elevated STAT-DNA binding activity in MCF-7 and T-47D breast cancer cells, as determined by EMSA. Similar results were observed in three independent experiments.
FIGURE 7.
FIGURE 7.
Contribution of Sp1-2 site to PKCϵ overexpression in breast cancer cells. A, mutation of Sp1-2 site decreases PKCϵ promoter activity in MCF-7 breast cancer cells but not in MCF-10A cells. Luciferase activity of pGL3−777/+219 (wild-type, Sp1-1 site mutant, or Sp1-2 site mutant) was determined 48 h after transfection. Data are expressed as mean ± S.E. of three individual experiments. Luciferase activity of wild-type pGL3−777/+219 construct was set as 1. **, p < 0.01 versus pGL3−777/+219 (WT). B, elevated Sp1-DNA binding activity in MCF-7 and T-47D breast cancer cells, as determined by EMSA. Similar results were observed in two independent experiments. C, mutation of Sp1-6/7 sites reduces PRKCE promoter activity both in MCF-7 and MCF-10A cells. Luciferase activity of pGL3−320/+219 (wild-type or Sp1-6/7 sites mutant) was determined 48 h after transfection. Data are expressed as mean ± S.E. of three individual experiments. Luciferase activity of wild-type pGL3−320/+219 construct was set as 1. **, p < 0.01 versus pGL3−320/+219 (wt).
FIGURE 8.
FIGURE 8.
Correlation between PKCϵ expression levels and STAT1 activation status. A, PKCϵ RNAi depletion reduces phospho-Ser-727-STAT1 levels in breast cancer cell lines. MCF-7, T-47D, MDA-MB-231, MDA-MB-453, and MDA-MB-468 cells were transiently transfected with PKCϵ (1 or 2) or nontarget control (NTC) RNAi duplexes. After 72 h, levels of phospho-Ser-727-STAT1 and total STAT1 were determined by Western blot. A second experiment gave similar results. B, effect of pan-PKC inhibitor GF109203X (5 μm, 24 h) or the PKCϵ inhibitor ϵV1-2 (1 μm, 24 h) on phospho-Ser-727-STAT1 levels in MCF-7 cells, as determined by Western blot (upper panel). A representative experiment is shown, together with densitometric analysis. Data are expressed as mean ± S.E. of four individual experiments. *, p < 0.05, **, p < 0.01 versus control. C, inhibition of pGL3−1416/+219 reporter activity in MCF-7 cells by ϵV1-2 (1 μm, 24 h). Luciferase activity of construct pGL3−1416/+219 was determined 48 h after transfection. Data are expressed as mean ± S.D. of triplicate samples. Two additional experiments gave same results. *, p < 0.05 versus control. D, inhibition of pGL3−1416/+219 reporter activity by PKCϵ RNAi. MCF-7 cells were transiently transfected with PKCϵ (1 or 2) or nontarget control RNAi duplexes. After 24 h, pGL3−1416/+219 was transiently transfected into MCF-7 cells along with the pRL-TK Renilla luciferase vector. Luciferase activity was determined 48 h later. Data are expressed as mean ± S.D. of triplicate samples. Two additional experiments gave same results. *, p < 0.05 versus control. Inset, PKCϵ expression, as determined by Western blot. E, PKCϵ and phospho-Ser-727-STAT1 levels in mammary cell lines, as determined by Western blot. Similar results were observed in three independent experiments. F, correlation between expression levels of PKCϵ and phospho-Ser-727-STAT1 levels in mammary cell lines.
FIGURE 9.
FIGURE 9.
PKCϵ RNAi depletion and Sp1 inhibition impair breast cancer cell migration. MCF-7 cells were transfected with PKCϵ or nontarget control (NTC) RNAi duplexes. After 24 h, MCF-7 cells were infected with either control LacZ adenovirus or PKCϵ adenovirus (multiplicity of infection = 0.5 pfu/cell) or were treated with the Sp1 inhibitor MTM (30 nm). After 48 h, migration in response to 5% FBS was determined using a Boyden chamber. A, migrated cells were counted from five independent fields. Data are expressed as mean ± S.D. (n = 3). **, p < 0.01; #, p < 0.01. B, expression of PKCϵ, as determined by Western blot. Similar results were obtained in two independent experiments.

References

    1. Kampfer S., Windegger M., Hochholdinger F., Schwaiger W., Pestell R. G., Baier G., Grunicke H. H., Uberall F. (2001) Protein kinase C isoforms involved in the transcriptional activation of cyclin D1 by transforming Ha-Ras. J. Biol. Chem. 276, 42834–42842 - PubMed
    1. Mesquita R. F., Paul M. A., Valmaseda A., Francois A., Jabr R., Anjum S., Marber M. S., Budhram-Mahadeo V., Heads R. J. (2014) Protein kinase Cϵ-calcineurin cosignaling downstream of toll-like receptor 4 downregulates fibrosis and induces wound healing gene expression in cardiac myofibroblasts. Mol. Cell Biol. 34, 574–594 - PMC - PubMed
    1. Quann E. J., Liu X., Altan-Bonnet G., Huse M. (2011) A cascade of protein kinase C isozymes promotes cytoskeletal polarization in T cells. Nat. Immunol. 12, 647–654 - PMC - PubMed
    1. Saurin A. T., Durgan J., Cameron A. J., Faisal A., Marber M. S., Parker P. J. (2008) The regulated assembly of a PKCϵ complex controls the completion of cytokinesis. Nat. Cell Biol. 10, 891–901 - PubMed
    1. Soh J. W., Weinstein I. B. (2003) Roles of specific isoforms of protein kinase C in the transcriptional control of cyclin D1 and related genes. J. Biol. Chem. 278, 34709–34716 - PubMed

Publication types

MeSH terms