

Prognostic value of tumor-infiltrating FoxP3+ T cells in gastrointestinal cancers: a meta analysis
- PMID: 24827118
- PMCID: PMC4020764
- DOI: 10.1371/journal.pone.0094376
Prognostic value of tumor-infiltrating FoxP3+ T cells in gastrointestinal cancers: a meta analysis
Abstract
Purpose: Tumor-infiltrating FoxP3+ T cells have been reported in various human tumors, which impaired cell-mediated immunity and promoted disease progression. However, its prognostic value for survival in patients with different gastrointestinal cancers [hepatocellular carcinoma (HCC), colorectal cancer (CRC), gastric cancer (GC)] remains controversial.
Methods: Relevant literature was searched using PubMed, Embase, Cochrane, Ovid Medline and Chinese wanfang databases. A meta-analysis was conducted to estimate pooled survival and recurrence ratios. The odds ratio (OR) and 95% confidence intervals (CI) were calculated employing fixed- or random-effects models depending on the heterogeneity of the included trials.
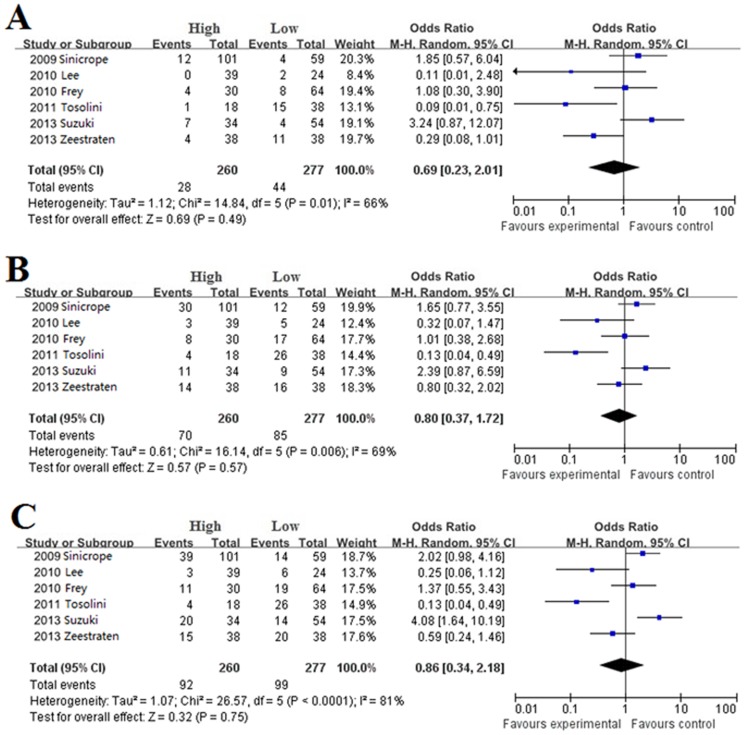
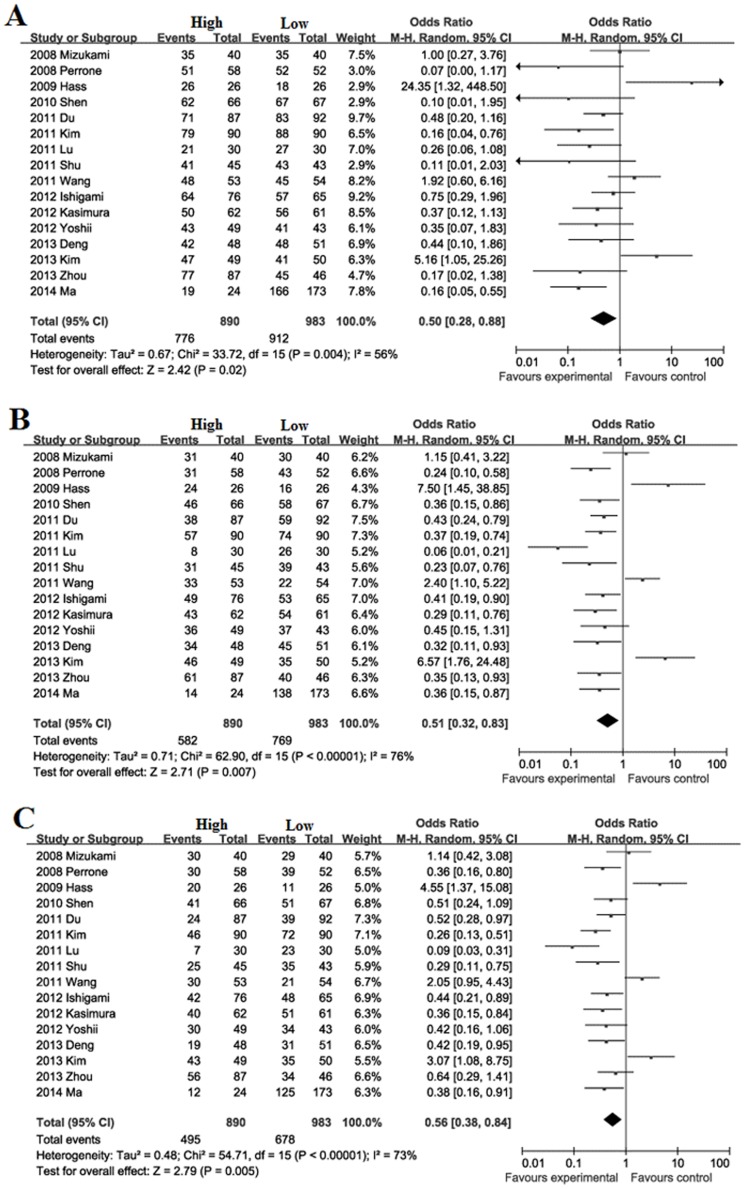
Results: For HCC and GC, the overall survival at 1, 3 and 5-year of high FoxP3+ T cells infiltration patients were lower than low FoxP3+ T cells infiltration patients (P<0.05). The recurrences at 1, 3 and 5-year of high FoxP3+ T cells infiltration patients were higher than low FoxP3+ T cells infiltration patients (P<0.001). But for CRC, the overall survival at 1, 3 and 5-year of high FoxP3+ T cells infiltration patients were higher than low FoxP3+ T cells infiltration patients (P<0.001). There were no differences in 1, 3 and 5-year recurrences between high and low FoxP3+ T cells infiltration patients (P>0.05).
Conclusions: Our findings suggested that tumor-infiltrating FoxP3+ T cells were a factor for a poor prognosis for HCC and GC, but a good prognosis for CRC.
Conflict of interest statement
Figures


Similar articles
-
Clinicopathologic and prognostic significance of tumor-infiltrating CD8+ T cells in patients with hepatocellular carcinoma: A meta-analysis.Medicine (Baltimore). 2019 Jan;98(2):e13923. doi: 10.1097/MD.0000000000013923. Medicine (Baltimore). 2019. PMID: 30633166 Free PMC article. Review.
-
Prediction of recurrence and survival in hepatocellular carcinoma based on two Cox models mainly determined by FoxP3+ regulatory T cells.Cancer Prev Res (Phila). 2013 Jun;6(6):594-602. doi: 10.1158/1940-6207.CAPR-12-0379. Epub 2013 Apr 18. Cancer Prev Res (Phila). 2013. PMID: 23599540
-
The Prognostic Value of Tumor-infiltrating Lymphocytes in Hepatocellular Carcinoma: a Systematic Review and Meta-analysis.Sci Rep. 2017 Aug 8;7(1):7525. doi: 10.1038/s41598-017-08128-1. Sci Rep. 2017. PMID: 28790445 Free PMC article.
-
Prognostic value of tumor-infiltrating FOXP3+ regulatory T cells in patients with hepatocellular carcinoma.Eur J Surg Oncol. 2008 Feb;34(2):173-9. doi: 10.1016/j.ejso.2007.08.008. Epub 2007 Oct 10. Eur J Surg Oncol. 2008. PMID: 17928188
-
CXCL17 expression predicts poor prognosis and correlates with adverse immune infiltration in hepatocellular carcinoma.PLoS One. 2014 Oct 10;9(10):e110064. doi: 10.1371/journal.pone.0110064. eCollection 2014. PLoS One. 2014. PMID: 25303284 Free PMC article.
Cited by
-
Tumor necroptosis is correlated with a favorable immune cell signature and programmed death-ligand 1 expression in cholangiocarcinoma.Sci Rep. 2021 Jun 3;11(1):11743. doi: 10.1038/s41598-021-89977-9. Sci Rep. 2021. PMID: 34083572 Free PMC article.
-
[Prognostic significance of immune cell infiltrates in tumor pathology].Pathologe. 2018 Nov;39(6):532-538. doi: 10.1007/s00292-018-0541-8. Pathologe. 2018. PMID: 30350175 Review. German.
-
Tumor-Infiltrating Lymphocytes and Adoptive Cell Therapy: State of the Art in Colorectal, Breast and Lung Cancer.Physiol Res. 2023 Oct 27;72(S3):S209-S224. doi: 10.33549/physiolres.935155. Physiol Res. 2023. PMID: 37888965 Free PMC article. Review.
-
Reduction of FoxP3+ Tregs by an immunosuppressive protocol of rapamycin plus Thymalfasin and Huaier extract predicts positive survival benefits in a rat model of hepatocellular carcinoma.Ann Transl Med. 2020 Apr;8(7):472. doi: 10.21037/atm.2020.03.129. Ann Transl Med. 2020. PMID: 32395516 Free PMC article.
-
The Clinicopathological and Prognostic Implications of FoxP3+ Regulatory T Cells in Patients with Colorectal Cancer: A Meta-Analysis.Front Physiol. 2017 Nov 21;8:950. doi: 10.3389/fphys.2017.00950. eCollection 2017. Front Physiol. 2017. PMID: 29209232 Free PMC article.
References
-
- Sakaguchi S, Sakaguchi N, Asano M, Itoh M, Toda M (1995) Immunologic self-tolerance maintained by activated T cells expressing IL-2 receptor α-chains (CD25). Breakdown of a single mechanism of self-tolerance causes various auto-immune diseases. J Immunol 155: 1151–1164. - PubMed
-
- deLeeuw RJ, Kost SE, Kakal JA, Nelson BH (2012) The prognostic value of FoxP3+ tumor-infiltrating lymphocytes in cancer: a critical review of the literature. Clin Cancer Res 18: 3022–3029. - PubMed
Publication types
MeSH terms
Substances
LinkOut - more resources
Full Text Sources
Other Literature Sources
Medical
Miscellaneous
