. 2014 Apr;6(4):320-34.
doi: 10.18632/aging.100657.

Aging synaptic mitochondria exhibit dynamic proteomic changes while maintaining bioenergetic function

Affiliations

Aging synaptic mitochondria exhibit dynamic proteomic changes while maintaining bioenergetic function

Kelly L Stauch et al. Aging (Albany NY). 2014 Apr.

Abstract

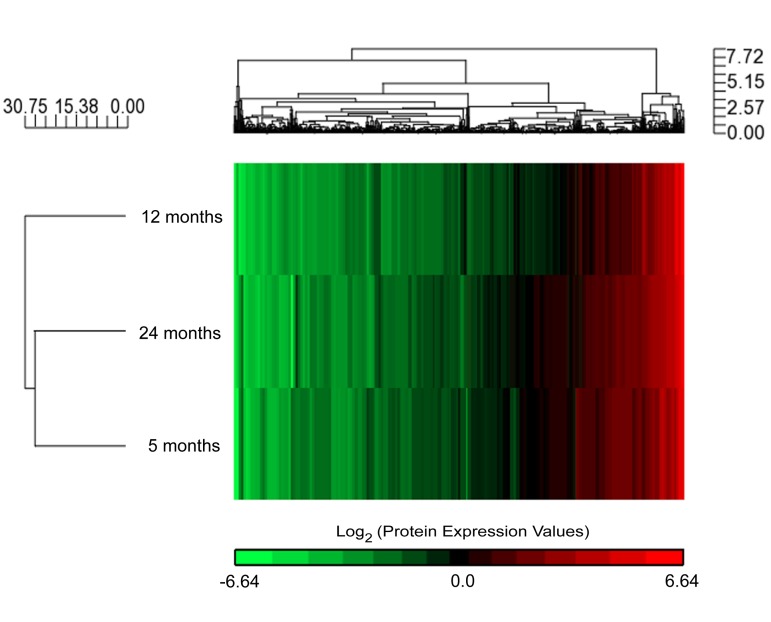
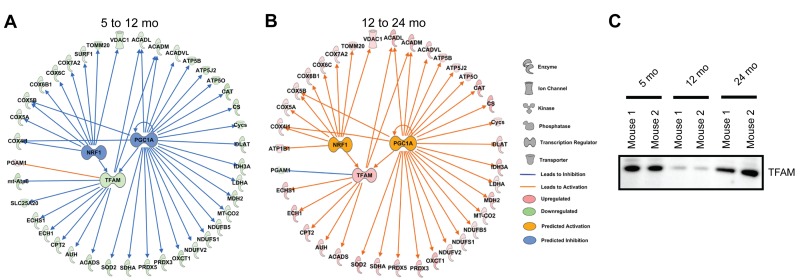
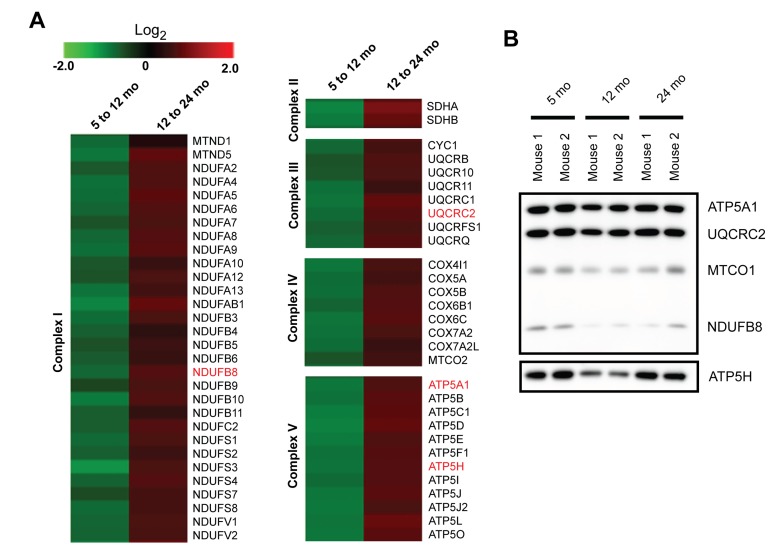
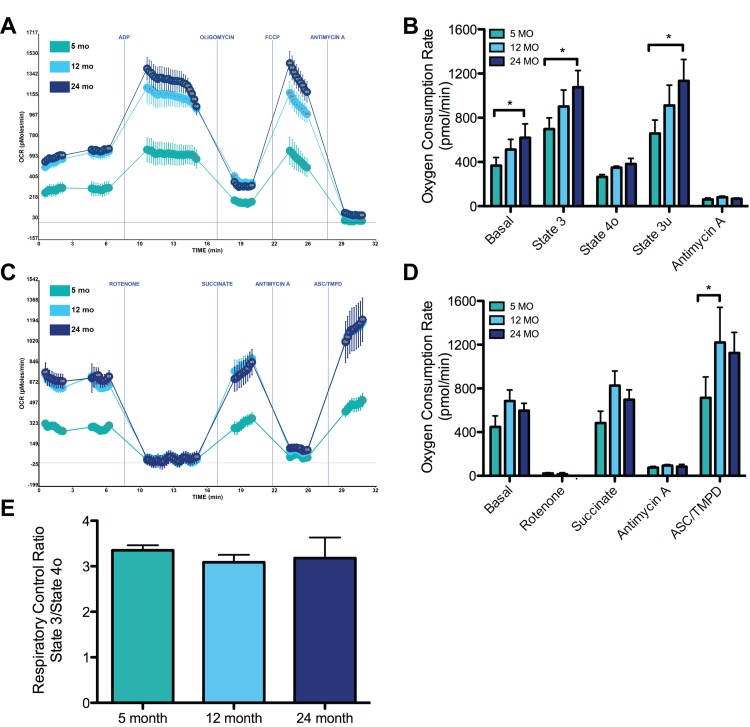
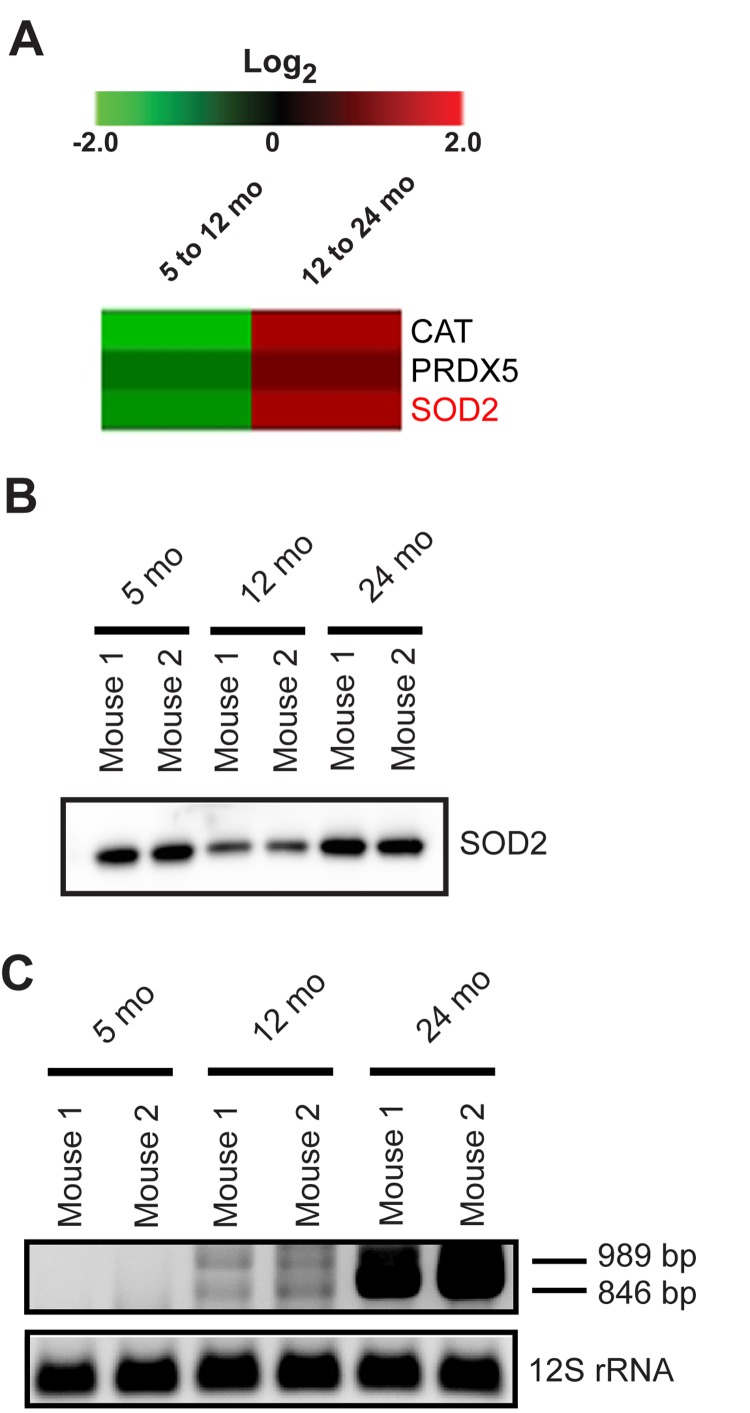
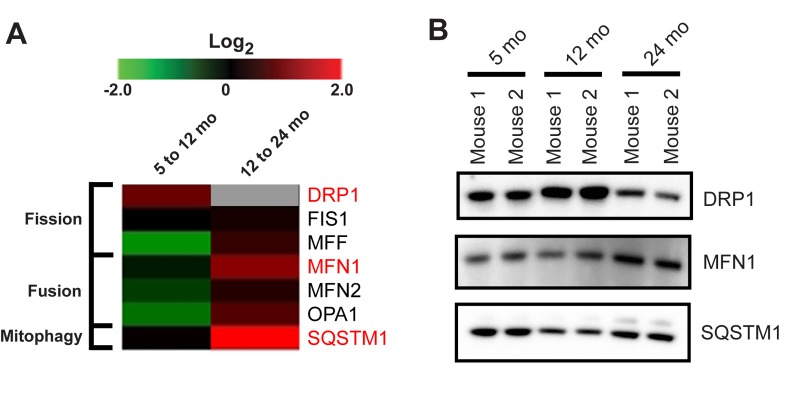
Aging correlates with a progressive impairment of mitochondrial homeostasis and is an influential factor for several forms of neurodegeneration. However, the mechanisms underlying age-related alterations in synaptosomal mitochondria, a neuronal mitochondria population highly susceptible to insults and critical for brain function, remain incompletely understood. Therefore this study investigates the synaptic mitochondrial proteomic and bioenergetic alterations that occur with age. The utilization of a state of the art quantitative proteomics approach allowed for the comparison of protein expression levels in synaptic mitochondria isolated from 5 (mature), 12 (old), and 24 (aged) month old mice. During the process of aging we find that dynamic proteomic alterations occur in synaptic mitochondria. Despite direct (mitochondrial DNA deletions) and indirect (increased antioxidant protein levels) signs of mitochondrial damage in the aged mice, there was an overall maintenance of mitochondrial function. Therefore the synaptic mitochondrial proteomic changes that occur with aging correlate with preservation of synaptic mitochondrial function.


Conflict of interest statement

The authors disclose that there are no actual or potential conflicts of interest.

Figures

Figure 1
Figure 1. Aging associated synaptic mitochondrial proteomic changes
Expression data derived from super-SILAC (H:L) ratios of 5, 12, and 24 month old mouse synaptic mitochondrial proteins. Hierarchical clustering analysis of log2 expression values for the common 898 identified and quantified proteins is presented here as a dendrogram.
Figure 2
Figure 2. Analysis of quantitative proteomics predicts dynamic changes in mitochondrial transcriptional regulatory circuits with aging
IPA generated NRF1, PGC1A, and TFAM upstream regulator networks overlaid with our proteomic expression data for synaptic mitochondria from (A) 5 to 12 month and (B) 12 to 24 month old mice. NRF1, PGC1A, and TFAM activity was predicted based on proteomic expression data. All proteins shown (except the nuclear proteins NRF1 and PGC1A) were found in the mitochondrial proteomic analysis. (C) Immunoblot orthogonal validation of TFAM protein expression.
Figure 3
Figure 3. Quantitative proteomics reveals altered expression of protein subunits in the electron transport chain with aging
(A) Heatmap of the protein expression changes from 5 to 12 months and 12 to 24 months in isolated synaptic mitochondria (log2 (12/5 months) and (24/12 months)). Proteins highlighted in red were verified orthogonally. (B) Immunoblot orthogonal validation of protein expression for selected proteins in (A).
Figure 4
Figure 4. Effects of aging on synaptic mitochondrial bioenergetics
Synaptic mitochondria from 5, 12, and 24 month mice were isolated and assayed as described in the Materials and Methods. (A) Representative graph output of coupling assay of isolated synaptic mitochondria. Point-to-point oxygen consumption rate (OCR) data are shown with succinate as the substrate followed by addition of ADP, oligomycin, FCCP, and antimycin A. (B) Basal (complex II), state 3, state 4o, state 3u respiration. *Significantly (p<0.05) lower in 5 vs. 24 month old animals, n = 5. (C) Representative graph output of electron flow assay. Point-to-point OCR data are shown with pyruvate and malate as the substrate followed by the addition of rotenone, succinate, antimycin A, and ASC/TMPD. (D) OCR response following rotenone inhibition of complex I, succinate driven complex II, antimycin A inhibition of complex III, and ASC/TMPD driven complex IV. *Significantly (p<0.05) lower in 5 vs. 12 month old animals, n = 3. (E) Respiratory Control Ratio (State 3/State 4o) shows no change between 5, 12, and 24 months.
Figure 5
Figure 5. Mitochondrial antioxidant proteins and mtDNA deletions in aging synaptic mitochondria
(A) Heatmap of the protein expression changes from 5 to 12 months and 12 to 24 months in isolated synaptic mitochondria (log2 (12/5 months) and (24/12 months)). SOD2 highlighted in red was verified orthogonally. (B) Immunoblot validation of SOD2 protein expression. (C) PCR analysis of DNA isolated from synaptic mitochondria revealing accumulation of age-associated mtDNA deletions. PCR product sizes of 989 and 846 bps represent deletions in the mtDNA genome between 9554/13278 and 9088/12956 bps, respectively. PCR of 12S rRNA is used as a control.
Figure 6
Figure 6. Proteomic changes suggest alterations in mitochondrial dynamics and mitophagy with age
(A) Heatmap of the protein expression changes from 5 to 12 month and 12 to 24 month in isolated synaptic mitochondria (log2 (12/5 months) and (24/12 months)). Gray box represents value not obtained in our proteomic experiment due to insufficient peptide confidence. Proteins highlighted in red were verified orthogonally. (B) Immunoblot validation of protein expression for selected proteins in (A).

References

    1. Lopez-Otin C, Blasco MA, Partridge L, Serrano M, Kroemer G. The hallmarks of aging. Cell. 2013;153:1194–1217. - PMC - PubMed
    1. Green DR, Galluzzi L, Kroemer G. Mitochondria and the autophagy-inflammation-cell death axis in organismal aging. Science. 2011;333:1109–1112. - PMC - PubMed
    1. Park CB, Larsson NG. Mitochondrial DNA mutations in disease and aging. J Cell Biol. 2011;193:809–818. - PMC - PubMed
    1. Shepherd GM, Harris KM. Three-dimensional structure and composition of CA3-->CA1 axons in rat hippocampal slices: implications for presynaptic connectivity and compartmen-talization. J Neurosci. 1998;18:8300–8310. - PMC - PubMed
    1. Murthy VN, De Camilli P. Cell biology of the presynaptic terminal. Annu Rev Neurosci. 2003;26:701–728. - PubMed