Review
. 2014 Aug;10(3):229-36.
doi: 10.2174/1573403x10666140514102754.

Updated electrocardiographic classification of acute coronary syndromes

Affiliations
Review

Updated electrocardiographic classification of acute coronary syndromes

Kjell Nikus et al. Curr Cardiol Rev. 2014 Aug.

Abstract

The electrocardiogram (ECG) findings in acute coronary syndrome should always be interpreted in the context of the clinical findings and symptoms of the patient, when these data are available. It is important to acknowledge the dynamic nature of ECG changes in acute coronary syndrome. The ECG pattern changes over time and may be different if recorded when the patient is symptomatic or after symptoms have resolved. Temporal changes are most striking in cases of ST-elevation myocardial infarction. With the emerging concept of acute reperfusion therapy, the concept ST-elevation/ non-ST elevation has replaced the traditional division into Q-wave/non-Q wave in the classification of acute coronary syndrome in the acute phase.

Keypoints: In acute coronary syndrome, in addition to the traditional electrocardiographic risk markers, such as ST depression, the 12-lead ECG contains additional, important diagnostic and prognostic information. Clinical guidelines need to acknowledge certain high-risk ECG patterns to improve patient care.


Figures

Fig. (1)
Fig. (1)
12-Lead ECG recorded during chest pain in a patient with acute occlusion of the left circumflex coronary artery. No significant lesions were present in the other coronary arteries. The ECG shows ST depression in leads V1 to V4 and only minor ST elevation, not fulfilling ST elevation myocardial infarction criteria, in leads I, aVL, and V6. (With permission from Elsevier).
Fig. (2)
Fig. (2)
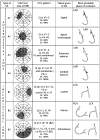
ECG patterns of Q-wave/Q-wave equivalent myocardial infarction on the 17-segment model of the left ventricle, with the names given to the infarcted left ventricular regions documented by cardiac myocardial resonance imaging. The 4 MI regions in the anteroseptal zone are designated as A1, A2, A3, and A4; the 3 MI regions in the inferolateral zone are designated as B1, B2, and B3. (With permission from Elsevier).
Fig. (3)
Fig. (3)
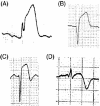
The ECG patterns of the preinfarction syndrome and evolving myocardial infarction. (A) The preinfarction syndrome: an elevated ST segment and a peaked T wave; (B) Evolving myocardial infarction without ECG signs of reperfusion: a deep Q wave, an elevated ST segment and a positive T wave; (C) Evolving myocardial infarction with incomplete reperfusion: ST elevation, a biphasic T wave (negative terminal portion); (D) Evolving myocardial infarction with complete reperfusion: minor ST elevation, negative T wave. (With permission from Oxford University Press).
Fig. (4)
Fig. (4)
Four consecutive ECGs (precordial leads V1 to V4) of a patient with an acutely occluded left anterior descending coronary artery. (A) Typical ST elevation during the occlusive phase; (B) ST resolution with (“post-ischemic”) T-wave inversion representing myocardial reperfusion; (C) Re-occlusion manifests as “pseudonormalization” of the T waves; (D) Reappearance of inverted T waves when myocardial ischemia has subsided. (Technical error in lead V2 in “C”). (With permission from Elsevier).
Fig. (5)
Fig. (5)
In a patient with left main coronary artery stenosis the ECG is normal when the patient is asymptomatic (A). During chest pain, the ECG pattern of circumferential subendocardial ischemia – widespread ST depression with inverted T waves and lead aVR ST elevation – is present (B). (With permission from Elsevier).
Fig. (6)
Fig. (6)
In a patient with acute coronary syndrome, 12-lead ECG shows diffuse ST depression with positive T waves in the inferior leads II, III and aVF, and in leads V2-V6 besides ST elevation in lead aVR. Coronary angiography showed a subtotal occlusion with impaired flow of the left anterior descending coronary artery (Technical artifact in lead V1). (With permission from Elsevier).

References

    1. Thygesen K, Alpert JS, Jaffe AS, Simoons ML, Chaitman BR, White HD. Third universal definition of myocardial infarction. J Am Coll Cardiol. 2012;60:1581–98. - PubMed
    1. Nikus K, Pahlm O, Wagner G , et al. Electrocardiographic classification of acute coronary syndromes: A review by a committee of the International Society for Holter and Non-invasive Electrocardiology. J Electrocardiol. 2010;43:91–103. - PubMed
    1. Blackburn H, Keys A, Simonson E, Rautaharju P, Punsar S. The electrocardiogram in population studies.A classification system. . Circulatio. 1960;21:1160–75. - PubMed
    1. Selvester RH, Wagner GS, Hindman NB. The Selvester QRS scoring system for estimating myocardial infarct size.the development and application of the system. Arch Intern Med. 1985;145:1877–81. - PubMed
    1. Carlsen EA, Bang LE, Ahtarovski KA , et al. Comparison of Selvester QRS score with magnetic resonance imaging measured infarct size in patients with ST elevation myocardial infarction. J Electrocardiol. 2012;45:414–9. - PubMed