

Review
doi: 10.2174/1573403x1003140522161728.
Clinical and experimental evidence of supernormal excitability and conduction
Affiliations
- PMID: 24827801
- PMCID: PMC4040872
- DOI: 10.2174/1573403x1003140522161728
Item in Clipboard
Review
Clinical and experimental evidence of supernormal excitability and conduction
Curr Cardiol Rev.
2014 Aug.
Abstract
True supernormality of excitability and conduction has been demonstrated in normal Purkinje fibers in in vitro studies. In the clinical setting, supernormality of conduction is manifested better than expected. This phenomenon is much more common than previously thought, particularly in the presence of certain clinical conditions. If a careful scanning of the cardiac cycle is performed on all patients with intermittent bundle branch block and second degree or advanced infranodal AV block, accessory pathways and mulfunctioning pacemakers, it is anticipated that a much larger amount of supernormal excitability and conduction will be unmasked.
Figures

Intracellular depolarizing currents necessary to trigger a response at the various times during repolarization from single canine Purkinje (left) and ordinary ventricular muscle (right). The abscissas indicate the times after the upstrokes of the action potential and the ordinates, the minimal depolarizing currents. A supernormal phase is observed only in the Purkinje fiber (see text for further description).

Intracellular stimulation in different cardiac fibers of the rabbit heart to explore the excitability thresholds at the moment of full repolarization (white bars) of the previous action potential and late in diastole (black bars). The diastolic threshold at full repolarization is the lowest only in Purkinje fibers, during the supernormal phase (see text for further comments).

Response to stimulation of a Purkinje fiber (left) and a ventricular fiber (right) at different times during and after the repolarization process. In each panel, the top tracing is the time scale (100 ms intervals), the second one is the response to stimulation of the action potentials and the lower tracing shows the dv/dt corresponding to each response (note the different scales. The first action potential in each panel is the last of a series of eight at a cycle length of 800 ms. The successive action potentials were evoked at progressively increasing S1S2 intervals. The earliest responses occur at a more negative membrane potential in the ventricular fiber with an almost normal rate of rise of the upstroke. The diagram at the bottom of A and B indicates the different periods of refractoriness and the supernormal phase of excitability (SF). ERP: effective refractory period; RRP: relative refractory period; TRP: total refractory period. See text for further comments.

Relationship between supernormal excitability and true physiologic supernormal conduction. A: Above: the action potentials were recorded in isolated Purkinje fiber 4 mm apart. P corresponds to the action potential recorded near the stimulating intracellular microelectrode and D indicates the distal action potential. The graph at the top indicates the minimal depolarizing currents with the excitability curve. Bottom: the graph plotted on the same time course as the action potentials show the conduction times between P and D recording sites. All data are plotted on the common time axis below. B: supernormal conduction in the His-Purkinje system of the intact canine heart. The ordinate indicates the conduction times between the electrograms from the His bundle and the distal RBB. The premature beats (h1-h2 intervals) are plotted on the abscissa. The supernormal phase with the increase in conduction of 2,2 ms (12,4%) occurred at h1-h2 intervals between 195 and 290 ms.

Impulses of a failing pacemaker (S) evoke ventricular captures (C) only during a restricted interval after the idioventricular beats (I) uncovering a supernormal phase of excitability. The bottom diagram indicates the I–S intervals at which S was probably subthreshold and ineffective (solid line) and the I-S intervals inducing a ventricular response (arrows) between 540 and 680 ms of the preceding beat. The fact that the patient had a prolonged QT interval explains the late position of the supernormal phase. The pacemaker impulses falling in the earliest part of the supernormal period show a variable latency (second and third captures).

The diastolic interval was fully scanned by subthreshold stimuli in an anesthetized dog using bipolar and cathodal (unipolar) stimulation delivered to the right ventricular endocardium in the apex (END.St) and to the epicardial surface close to the base (EPIC.St). The ECG strips to the left show ventricular responses evoked only during a short interval suggesting a supernormal phase of excitability while the ECG strips to the right show ineffective stimuli at different time intervals during diastole. Diagrams on the right summarize the results of the full diastolic scanning for each type of stimulation. The arrows indicate the periods of supernormal excitability.

A: Position of the supernormal phase of conduction in 12 cases (short-white bar to the left) in relation to the total duration of refractoriness (black bar) and to the end of the T wave (black arrows). In each case supernormality was demonstrated during a full scan of induced premature atrial beats during the diastolic interval including a His bundle recording. The supernormal phase is thus given in H1-H2 intervals. B: a similar illustration of 8 cases of intermittent bundle branch block uncovered by spontaneously occurring atrial premature beats and induced changes of cardiac rate by carotid sinus massage. Since His bundle recording was not done, the supernormal phase is given in R.R intervals. The position of the supernormal phase is similar to the cases shown in A. White bars to the right indicate normal conduction after the end of refractoriness achieved in some cases by carotid sinus massage.

Supernormal conduction in a patient with intermittent RBBB. Simultaneous recording of lead V1 and His bundle electrogram during programmed premature atrial stimulation at a basic cycle length of 800 ms. Panels A to C are described in the text. Panel D depicts the position of the supernormal phase of conduction (white bar to the left) within the prolonged refractory period (black bar). The white bar on the right represents normal conduction up to cycle lengths of 1,400 ms.

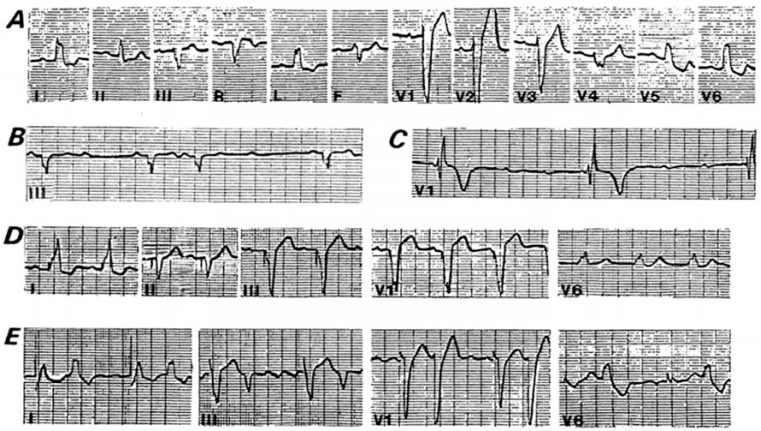
Supernormal conduction in a case of intermittent LBBB. Atrial premature beats disclose a supernormal phase of conduction during a short period of the cardiac cycle. The heart rate was changed by carotid sinus massage. A: simultaneous recording of leads V4 and I. High degree of LBBB occurred in beats closing RR intervals between 780 and 860 ms and normal intraventricular conduction during the supernormal phase at R-R of 590 and 550 ms (2nd and 7th beats), respectively. B: Discontinuous recording of lead V6. Normal intraventricular conduction of beats falling after the end of the total refractory period ocurred at RR intervals between 1,120 and 1,670 ms. The total refractory period was estimated to last about 1,020 ms. Premature atrial beats falling between 540 and 590 ms were normally conducted or show a small degree of LBBB suggesting the existence of a supernormal phase. C: The diagram at the bottom illustrates the ranges of block (black bars) and conduction during the supernormal phase (white bar to the left) and beyond the end of the total refractory period (to the right).

An example of 2:1 supernormal conduction in the left bundle branch. A: normal conduction is observed at a cycle length of 620-640 ms, while persistent LBBB occurred when the cycle length is shortened to 460-480 ms (panel B) after the administration of atropine. A further shortening of the cycle length to 420-430 ms (panel C) resulted in 2:1 LBBB in the presence of a supernormal phase. Panel D discloses the position of the supernormal phase and the total duration of refractoriness in the LBB (refer to text for further comments).

Examples of early (EC) and late (LC) captures in cases of advanced AV block. A: leads I, II and II are discontinuous. The idioventricular rhythm shows a pattern of RBBB with left anterior hemiblock, while early and late captures exhibit LBBB pattern preceded by a similar PR interval. AV conduction via the RBB only occurs when the RP intervals are about 560 ms (EC) or 1,600 ms or more (LC). The last negative P wave in the third strip (lead III) indicates retrograde conduction to the atria. B: another example of true supernormal AV conduction in the presence of advanced AV block. Leads III and V1 are discontinuous. The idioventricular rhythm shows a LBBB pattern whereas both, early (EC) and late (LC) captures exhibit RBBB pattern. This implies that the RBB is totally interrupted and the one exhibiting a long refractory period and a supernormal phase is the LBB. The arrows in the top strip (lead III) show retrograde conduction to the atria (negative P waves after beats 3 and 6).
Supernormal AV conduction in a patient with advanced AV block after the implant of a permanent pacemaker. Tracings from A to D were obtained at different dates during successive controls of the patient. A: normal sinus rhythm with LBBB; B: 3:2 Mobitz II AV block; C: complete AV block; D: a permanent pace marker was implanted; E: the patient developed atrial flutter. The first QRS complex in each lead corresponds to a paced beat and the second one to an early ventricular capture during the supernormal phase. The rapid atrial rate of the flutter allows AV conduction whenever the atrial impulse hits the supernormal period. Interestingly, this early captures were erroneously interpreted as ventricular premature beats and treated as such with an antiarrhythmic drug.

Mobitz II type block showing the development of a 3:2 periodicity. The R-R, R-P and P-P intervals are indicated in ms. A: 1:1 AV conduction with R-R intervals between 1,150 and 1,460 ms. B: increasing the sinus rate a 2:1 AV conduction was obtained with P-P intervals between 740 and 850 ms; C: with a further increase of the sinus rate a 3:2 periodicity occurs in the presence of a clear-cut constant ventriculophasic arrhythmia. The diagram at the bottom represents the total duration of refractoriness (black bar) during which P waves are blocked. P waves are normally conducted early during the supernormal phase (small white bars on the left) or late after the end of refractoriness (long white bar). All figures are in milliseconds. See text for further comments.

Electrophysiological study from a patient that had shown Mobitz II AV block, at a time when 1: 1 AV conduction was prevalent. A full scan of the cardiac cycle disclosed a typical supernormal phase of AV conduction as illustrated in the bottom diagram (white bar to the left). See text for a detailed description.

Position of the supernormal phase (white bar to the left) within the cardiac cycle in 18 cases of Mobitz II AV block. The arrows indicate the relationship of the supernormal period with the end of the T wave. The black bar to the right represents the total duration of refractoriness. The white bars to the right indicate the RR intervals during which P waves are conducted to the ventricles with a PR interval similar to the one observed during the supernormal phase. Normal AV conduction after longer pauses ruled out the presence of phase 4 blocks.

Mobitz II block with 3:2 periodicities at a constant rate of stimulation showing shortening of the H-V interval. A: lead V1 and His bundle electrogram were simultaneously recorded. The second HV (and P-R) interval of each 3:2 period shortens 55 ms. B: simultaneous recording of lead II and His bundle electrogram. Like in the example in A, the second HV interval shortens 10 ms. The HV and RH intervals in A and B are in milliseconds. These examples demonstrate that 3:2 Mobitz II AV block may occur in the absence of ventriculophasic arrhythmia.

Relationship between supernormal conduction, paroxysmal phase 3 block (tachycardia dependent block) and concealed conduction in a patient with permanent RBBB and left posterior hemiblock and intermittent conduction in the anterior division of the LBB. PP intervals are in milliseconds (see text for further description).

Supernormal conduction in the absence of manifest ventricular pre-excitation. The second beat in each panel is the last of a series of eight sinus beats and the third beat results of atrial stimulation at progressively shorter intervals. Supernormal conduction is the only means by which anterograde conduction over the accessory pathway could be demonstrated (see text for further details).

Supernormal conduction over the accessory pathway during premature atrial stimulation. Simultaneous recordings of His bundle electrogram, leads I, II and V1 at A1-A2 intervals between 360 and 490ms. In each panel the first beat is the last of a series of eight spontaneous sinus beats at a cycle length of 800 to 900 ms showing a small degree of pre-excitation (fusion beats between pre-excited and normally excited ventricle). PP intervals are in milliseconds. The diagram (bottom right) depicts the total duration of refractoriness in the accessory bundle (black bar) and the white bar (to the left), the supernormal phase of conduction (see text for a more detailed description).

Anterograde supernormal conduction through the accessory pathway of a patient with recurrent syncopal attacks. Twelve leads simultaneously recorded during the IV isoproterenol infusion from a patient with absence of ventricular pre-excitation on the ECG at baseline. In the electrophysiologic study, rapid atrial stimulation caused a very fast ventricular response (300 beats/min) during the supernormal phase of excitability and conduction of the accessory pathway (see text for more details).

A and B. Supernormal conduction through the accessory pathway as the only manifestation of pre-excitation (see full description in the text).

Retrograde supernormal conduction uncovered by programmed right ventricle pacing. The diagram at the bottom discloses the total refractory period (black bar) and the supernormal phase of conduction (white bar to the left). See text for a more detailed description.

Type I gap in AV
conduction. In each panel, recordings from top to bottom are leads I, III and
V1, high right atrium (HRA), His bundle electrogram (HBE) and time lines at 10
and 100 ms. A1, H1, V1 are the electrograms of the basic drive beats, while A2,
H2 and V2 correspond to the premature beats delivered progressively earlier from
440 to 360 ms; S: stimulus artifact. A: the basic drive rate A1-H1 is 700
ms. A premature atrial impulse (A2) is delivered at A1-A2 of 440 ms; B:
A2 blocks within the His-Purkinje system. The effective refractory period (EFP)
of the His –Purkinje system (HPS) is encountered at an H1-H2 interval of 380 ms.
In C, AV conduction resumes at a shorter A1-A2 interval (350 ms). Note
the increase in AV nodal delay (135 to 245 ms). The resulting H1-H2 interval
increases from 425 to 515 ms and is now outside the ERP of the HPS. During
resumption of AV conduction, the QRS complexes may be normal or may show
intraventricular aberrant conduction (modified from Damato A et al.
[56]).
References
-
- Hoff HE, Nahum LM. The supernormal period in the mammalian ventricle. Am J Physiol. 1938;124:591–5.
-
- Spear JF, Moore EN. Supernormal excitability and conduction in the His-Purkinje system of the dog. Circ Res. 1974;35:782–92. - PubMed
Publication types
MeSH terms
LinkOut - more resources
Full Text Sources
Other Literature Sources
Medical