

Flower colours through the lens: quantitative measurement with visible and ultraviolet digital photography
- PMID: 24827828
- PMCID: PMC4020805
- DOI: 10.1371/journal.pone.0096646
Flower colours through the lens: quantitative measurement with visible and ultraviolet digital photography
Abstract
Background: The study of the signal-receiver relationship between flowering plants and pollinators requires a capacity to accurately map both the spectral and spatial components of a signal in relation to the perceptual abilities of potential pollinators. Spectrophotometers can typically recover high resolution spectral data, but the spatial component is difficult to record simultaneously. A technique allowing for an accurate measurement of the spatial component in addition to the spectral factor of the signal is highly desirable.
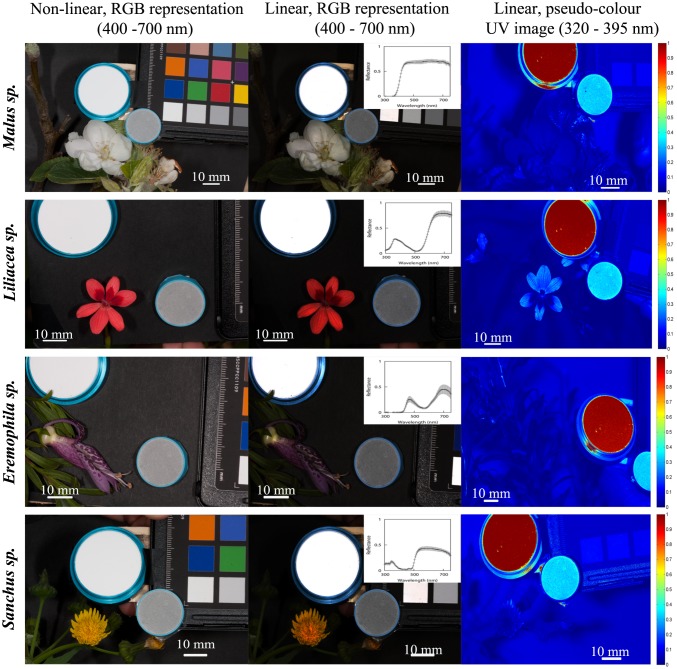
Methodology/principal findings: Consumer-level digital cameras potentially provide access to both colour and spatial information, but they are constrained by their non-linear response. We present a robust methodology for recovering linear values from two different camera models: one sensitive to ultraviolet (UV) radiation and another to visible wavelengths. We test responses by imaging eight different plant species varying in shape, size and in the amount of energy reflected across the UV and visible regions of the spectrum, and compare the recovery of spectral data to spectrophotometer measurements. There is often a good agreement of spectral data, although when the pattern on a flower surface is complex a spectrophotometer may underestimate the variability of the signal as would be viewed by an animal visual system.
Conclusion: Digital imaging presents a significant new opportunity to reliably map flower colours to understand the complexity of these signals as perceived by potential pollinators. Compared to spectrophotometer measurements, digital images can better represent the spatio-chromatic signal variability that would likely be perceived by the visual system of an animal, and should expand the possibilities for data collection in complex, natural conditions. However, and in spite of its advantages, the accuracy of the spectral information recovered from camera responses is subject to variations in the uncertainty levels, with larger uncertainties associated with low radiance levels.
Conflict of interest statement
Figures
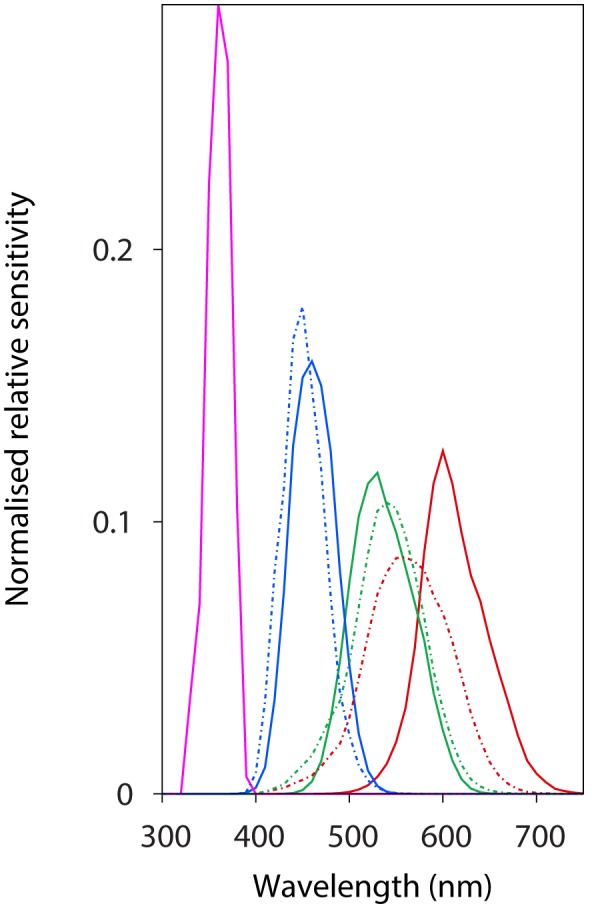
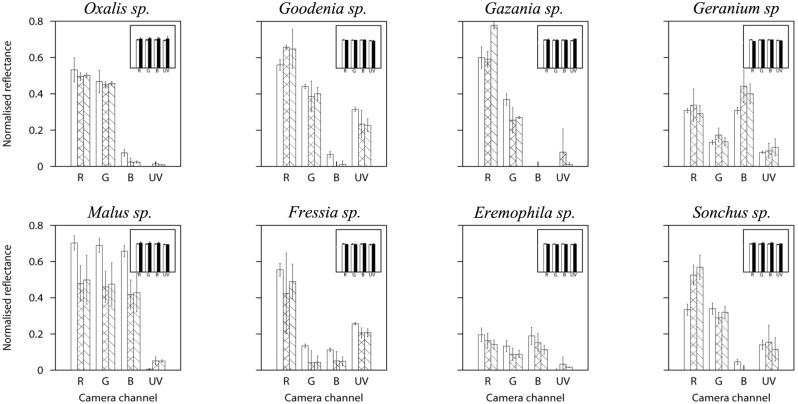
 by the total area under each channel/photoreceptor curve.
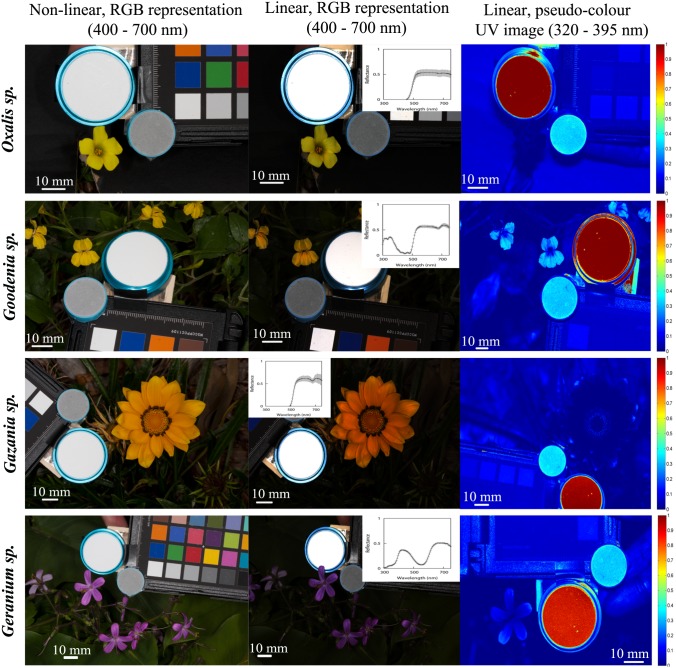
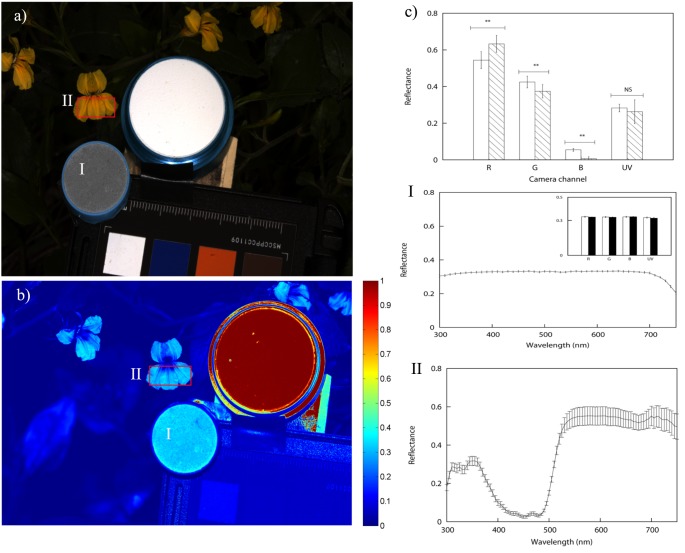
 P-value significant at
  ; NS P-value not significant at
  . Refer to text for details.
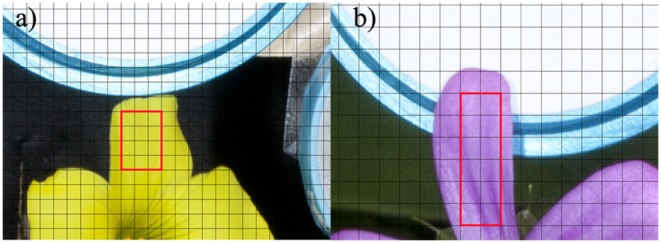
 3 sampling scheme, grid size 40 pixels. b) Geranium sp. 6
 2 sampling scheme, grid size 30 pixels.
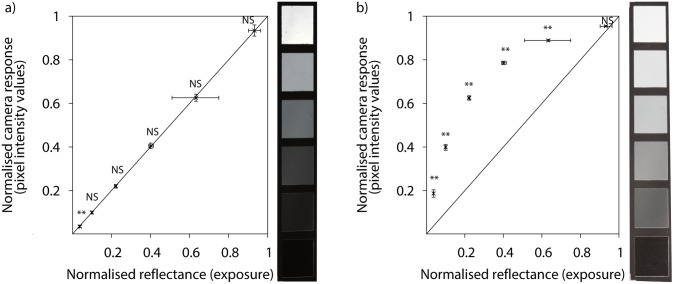
 P-value significant at
  ; NS P-value not significant at
  .
.
References
-
- Barth FG (1985) Insects and owners: the biology of a partnership. Princeton: Princeton University Press.
-
- Waddington KD (1983) Foraging behaviour of pollinators. In: Real L, editor, Pollination biology, New York: Academic Press. 213–239.
-
- Chittka L, Spaethe J, Schmidt A, Hickelsberger A (2001) Adaptation, constraint, and chance in the evolution of owner colour and pollinator colour vision. In: Chittka L, Thomson D, editors, Cognitive ecology of pollination, Cambridge: Cambridge University Press. 106–126.
-
- Chittka L, Thomson JD, Waser NM (1999) Flower constancy, insect psychology, and plant evolution. Naturwissenschaften 86: 361–377.
-
- Darwin C (1876) On the effects of cross and self fertilisation in the vegetable kingdom. London: Murray.
Publication types
MeSH terms
LinkOut - more resources
Full Text Sources
Other Literature Sources
