

Dendritic planarity of Purkinje cells is independent of Reelin signaling
- PMID: 24828132
- PMCID: PMC4481330
- DOI: 10.1007/s00429-014-0780-2
Dendritic planarity of Purkinje cells is independent of Reelin signaling
Abstract
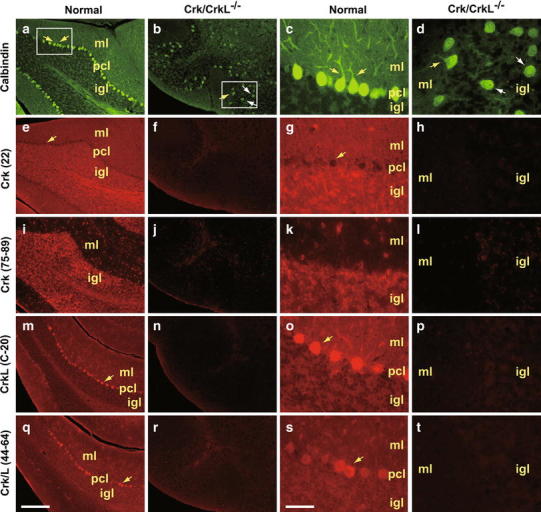
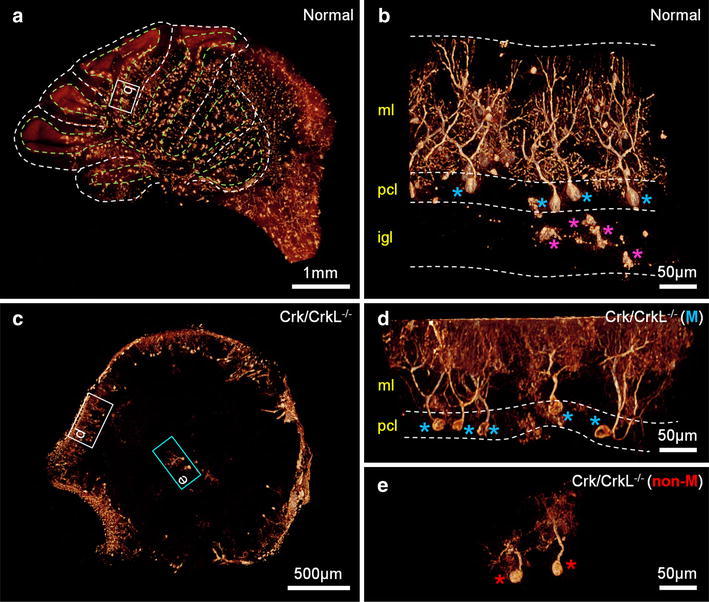
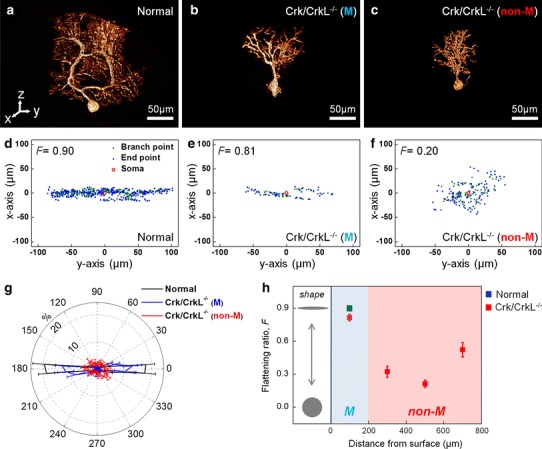
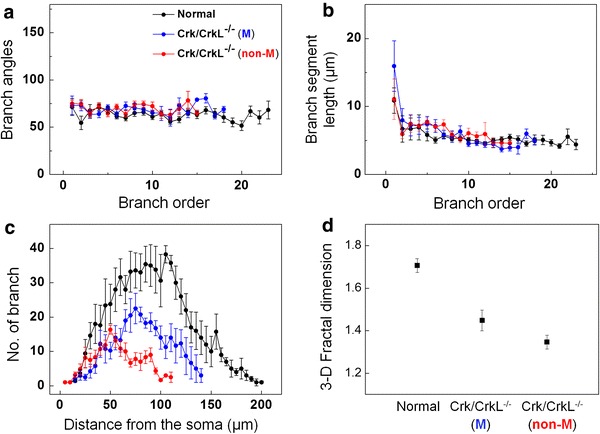
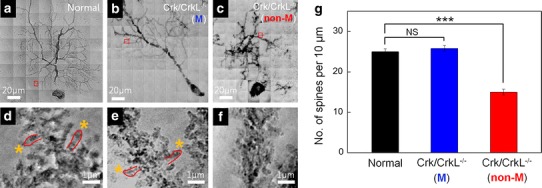
The dendritic planarity of Purkinje cells is critical for cerebellar circuit formation. In the absence of Crk and CrkL, the Reelin pathway does not function resulting in partial Purkinje cell migration and defective dendritogenesis. However, the relationships among Purkinje cell migration, dendritic development and Reelin signaling have not been clearly delineated. Here, we use synchrotron X-ray microscopy to obtain 3-D images of Golgi-stained Purkinje cell dendrites. Purkinje cells that failed to migrate completely exhibited conical dendrites with abnormal 3-D arborization and reduced dendritic complexity. Furthermore, their spines were fewer in number with a distorted morphology. In contrast, Purkinje cells that migrated successfully displayed planar dendritic and spine morphologies similar to normal cells, despite reduced dendritic complexity. These results indicate that, during cerebellar formation, Purkinje cells migrate into an environment that supports development of dendritic planarity and spine formation. While Reelin signaling is important for the migration process, it does not make a direct major contribution to dendrite formation.
Figures
Similar articles
-
Crk and Crk-like play essential overlapping roles downstream of disabled-1 in the Reelin pathway.J Neurosci. 2008 Dec 10;28(50):13551-62. doi: 10.1523/JNEUROSCI.4323-08.2008. J Neurosci. 2008. PMID: 19074029 Free PMC article.
-
Reduction of Crk and CrkL expression blocks reelin-induced dendritogenesis.J Cell Sci. 2008 Jun 1;121(11):1869-75. doi: 10.1242/jcs.027334. Epub 2008 May 13. J Cell Sci. 2008. PMID: 18477607 Free PMC article.
-
Migration, early axonogenesis, and Reelin-dependent layer-forming behavior of early/posterior-born Purkinje cells in the developing mouse lateral cerebellum.Neural Dev. 2010 Sep 1;5:23. doi: 10.1186/1749-8104-5-23. Neural Dev. 2010. PMID: 20809939 Free PMC article.
-
Reelin Functions, Mechanisms of Action and Signaling Pathways During Brain Development and Maturation.Biomolecules. 2020 Jun 26;10(6):964. doi: 10.3390/biom10060964. Biomolecules. 2020. PMID: 32604886 Free PMC article. Review.
-
A missed exit: Reelin sets in motion Dab1 polyubiquitination to put the break on neuronal migration.Genes Dev. 2007 Nov 15;21(22):2850-4. doi: 10.1101/gad.1622907. Genes Dev. 2007. PMID: 18006681 Review. No abstract available.
Cited by
-
Cytoskeleton stability is essential for the integrity of the cerebellum and its motor- and affective-related behaviors.Sci Rep. 2018 Feb 15;8(1):3072. doi: 10.1038/s41598-018-21470-2. Sci Rep. 2018. PMID: 29449678 Free PMC article.
-
Dendritic Self-Avoidance and Morphological Development of Cerebellar Purkinje Cells.Cerebellum. 2018 Dec;17(6):701-708. doi: 10.1007/s12311-018-0984-8. Cerebellum. 2018. PMID: 30270408 Review.
-
Regulation of dendrite morphogenesis by extrinsic cues.Trends Neurosci. 2015 Jul;38(7):439-47. doi: 10.1016/j.tins.2015.05.003. Epub 2015 Jun 20. Trends Neurosci. 2015. PMID: 26100142 Free PMC article. Review.
-
LRP4 LDLα repeats of astrocyte enhance dendrite arborization of the neuron.Mol Brain. 2020 Dec 10;13(1):166. doi: 10.1186/s13041-020-00708-z. Mol Brain. 2020. PMID: 33302985 Free PMC article.
References
-
- Chen YT, Lo TN, Chu YS, Yi J, Liu CJ, Wang JY, Wang CL, Chiu CW, Hua TE, Hwu Y, Shen Q, Yin GC, Liang KS, Lin HM, Je JH, Margaritondo G. Full-field hard X-ray microscopy below 30 nm: a challenging nanofabrication achievement. Nanotechnology. 2008;19:395302. doi: 10.1088/0957-4484/19/39/395302. - DOI - PubMed
Publication types
MeSH terms
Substances
LinkOut - more resources
Full Text Sources
Other Literature Sources
