. 2014 May 13;15(5):8458-72.
doi: 10.3390/ijms15058458.

MicroRNA-103 promotes colorectal cancer by targeting tumor suppressor DICER and PTEN

Affiliations

MicroRNA-103 promotes colorectal cancer by targeting tumor suppressor DICER and PTEN

Li Geng et al. Int J Mol Sci. .

Abstract

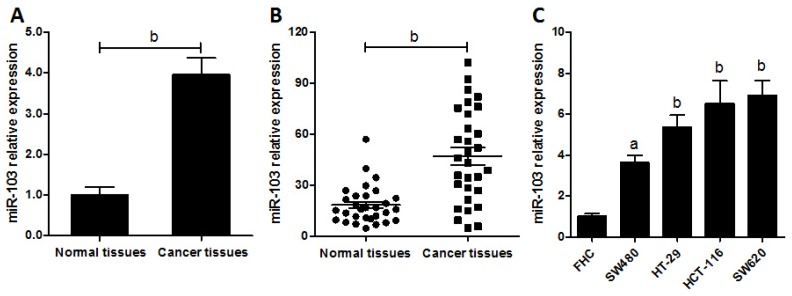
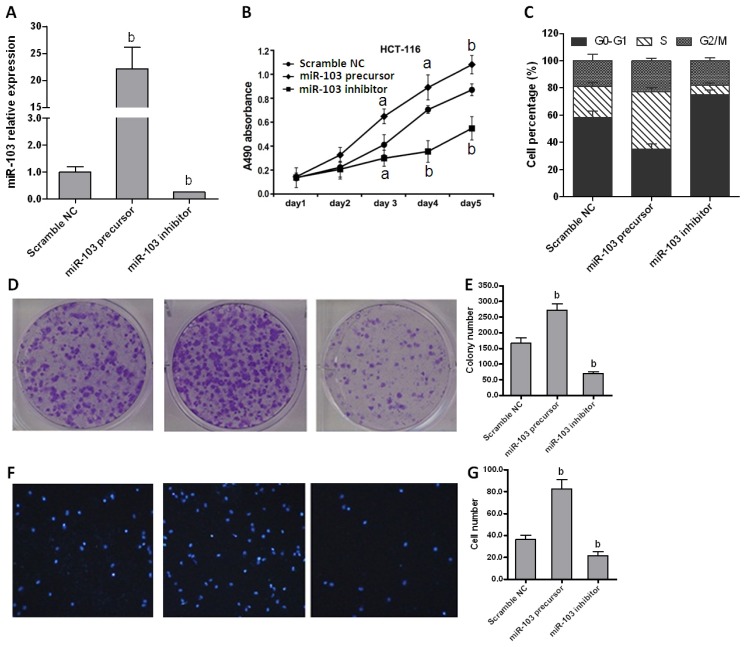
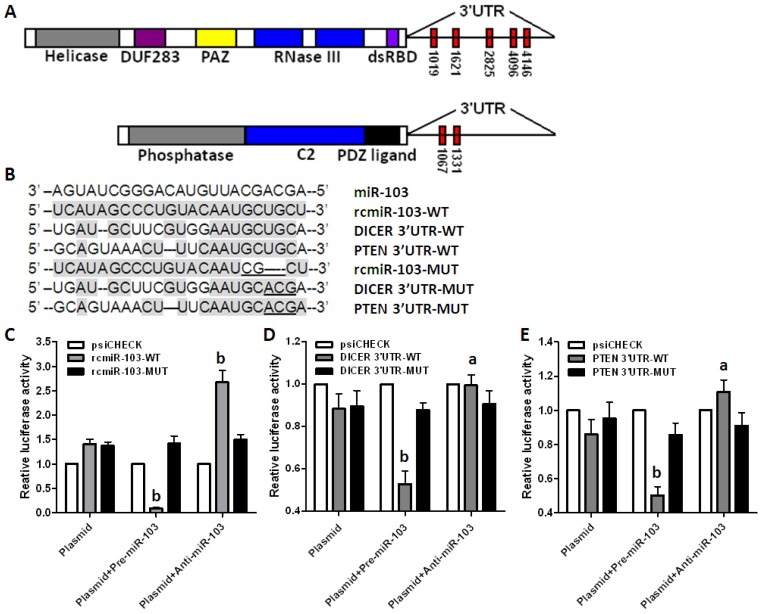
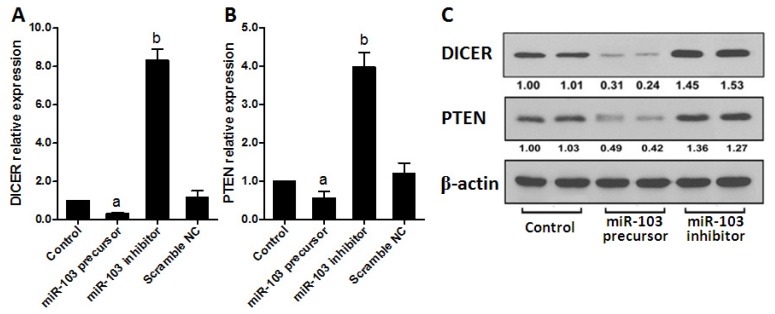
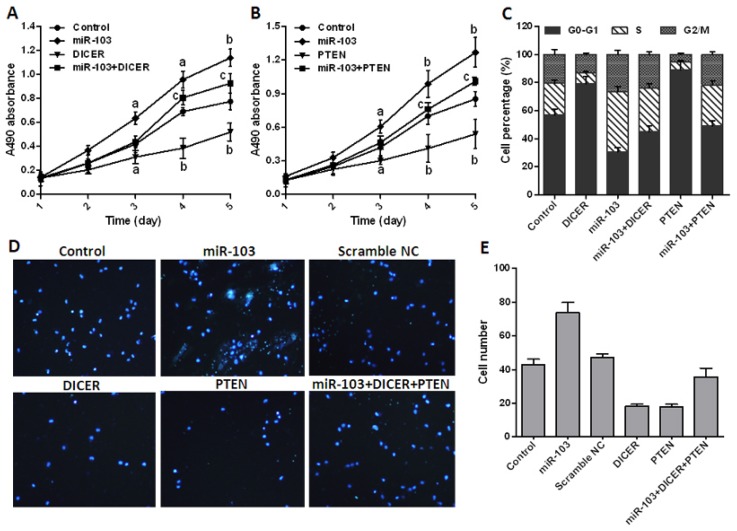
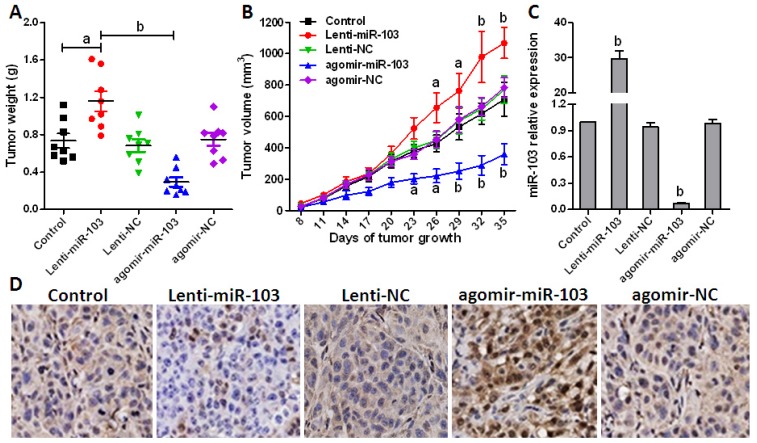
MicroRNAs (miRNAs) are a class of small, noncoding RNAs that act as key regulators in various physiological and pathological processes. However, the regulatory mechanisms for miRNAs in colorectal cancer remain largely unknown. Here, we found that miR-103 is up-regulated in colorectal cancer and its overexpression is closely associated with tumor proliferation and migration. In addition, repressing the expression of miR-103 apparently inhibits colorectal cancer cell proliferation and migration in vitro and HCT-116 xenograft tumor growth in vivo. Subsequent software analysis and dual-luciferase reporter assay identified two tumor suppressor genes DICER and PTEN as direct targets of miR-103, and up-regulation of DICER and PTEN obtained similar results to that occurred in the silencing of miR-103. In addition, restoration of DICER and PTEN can inhibit miR-103-induced colorectal cancer cell proliferation and migration. Our data collectively demonstrate that miR-103 is an oncogene miRNA that promotes colorectal cancer proliferation and migration through down-regulation of the tumor suppressor genes DICER and PTEN. Thus, miR-103 may represent a new potential diagnostic and therapeutic target for colorectal cancer treatment.


Figures

Figure 1.
Figure 1.
miR-103 is up-regulated in colorectal cancer. (A) RNAs were isolated from the colorectal cancer tissues and the matched normal control tissues, and miRNA expression profiles were determined by miRNA microarray. miR-103 expression was normalized to control of random sequences of a similar size. One representative of two experiments is shown; (B) The expression level of mature miR-103 in colorectal cancer tissues and their matched normal tissues were determined by real-time polymerase chain reaction (PCR); and (C) The expression level of miR-103 in four colorectal cancer cell lines and normal colonic cells were checked by real-time PCR. Data are representative of three experiments. Error bars represent as mean ± SD. a p < 0.05; b p < 0.01 vs. normal control.
Figure 2.
Figure 2.
miR-103 affects colorectal carcinoma cell proliferation and cell cycle in vitro. (A) Expression of miR-103 in HCT-116 cells transfected with scramble negative control (NC), miR-103 precursor or inhibitor was quantified by real-time PCR; (B) Proliferation rates of HCT-116 cells were detected by 3-(4,5-dimethylthiazol-2-yl)-2,5-diphenyltetrazolium bromide (MTT) assay; (C) Cell cycle distributions of HCT-116 cells were analyzed by flow cytometry; (D) HCT-116 cells were cultured for 10 days after transfection and cell viability was analyzed by colony formation assay; (E) analysis results of D; (F) Transwell assay was used to detect cell migration (40× magnification). Data are representative of three experiments; and (G) analysis results of F. Data are representative of three experiments. Error bars represent as mean ± SD. a p < 0.05; b p < 0.01 vs. scramble NC.
Figure 3.
Figure 3.
DICER and PTEN are direct target genes of miR-103. (A) Schematic gene structure of DICER and PTEN and the miR-103 recognition sites located in the 3′-untranslated region (3′-UTR) are shown as red rectangles; (B) Sequence alignment of miR-103 with reverse complementary miR-103 (rcmiR-103-WT), DICER (DICER-3′-UTR-WT), PTEN (PTEN-3′-UTR-WT), mutant rcmiR-103 (rcmiR-103-MUT), mutant DICER (DICER-3′-UTR-MUT), and mutant PTEN (PTEN-3′-UTR-MUT), mutant nucleotides are underlined; and (CE) Dual-luciferase reporter assay using constructed vectors alone or in the presence of miR-103 precursor or inhibitor was performed. Vectors contain rcmiR-103-WT and rcmiR-103-MUT was used as controls. Renilla luciferase was measured and normalized to Firefly luciferase activity, and the recombinant vector was normalized to empty vector. Data are representative of three experiments. a p < 0.05; b p < 0.01 vs. vector alone group.
Figure 4.
Figure 4.
miR-103 regulates DICER and PTEN expression in colorectal cancer cells. (A,B) mRNA levels of DICER and PTEN were determined by real-time PCR in transfected HCT-116 cells; and (C) Western blots were used to confirm the expression of DICER and PTEN in HCT-116 cells after transfection and β-actin was used as control. Data are representative of three experiments. Error bars represent as mean ± SD. a p < 0.05; b p < 0.01 vs. control.
Figure 5.
Figure 5.
miR-103 promotes colorectal cancer cell proliferation and cell cycle by targeting DICER and PTEN. (A,B) 3-(4,5-Dimethylthiazol-2-yl)-2,5-diphenyltetrazolium bromide (MTT) assay was used to check the proliferation rates of transfected HCT-116 cells; (C) Cell cycle distributions of transfected HCT-116 were analyzed by flow cytometry; (D) Transwell assay was used to detect cell migration (40× magnification); and (E) analysis results of D. Data are representative of three experiments. Error bars represent as mean ± SD. a p < 0.05; b p < 0.01 vs. control; c p < 0.05 vs. miR-103 transfection group.
Figure 6.
Figure 6.
miR-103 promotes colorectal cancer xenograft growth. (A) Xenograft models (n = 8) in nude mice were generated with transfected HCT-116 cells as indicated. Tumor size was measured every three days for 5 weeks; (B) Xenograft tumors in nude mice were weighed; (C) Relative miR-103 expression in xenografts was analyzed by real-time PCR; and (D) PTEN in tumor tissues from various groups was detected with immunohistochemistry using specific PTEN antibodies (200× magnification). Error bars represent as mean ± SD. a p < 0.05; b p < 0.01 vs. control.

References

    1. Jemal A., Ward E., Hao Y., Thun M. Trends in the leading causes of death in the United States, 1970–2002. JAMA. 2005;294:1255–1259. - PubMed
    1. Jafri S.H., Mills G. Lifestyle modification in colorectal cancer patients: An integrative oncology approach. Future Oncol. 2013;9:207–218. - PubMed
    1. Bjerrum J.T., Nielsen O.H., Wang Y.L., Olsen J. Technology insight: Metabonomics in gastroenterology-basic principles and potential clinical applications. Nat. Clin. Pr. Gastroenterol. Hepatol. 2008;5:332–343. - PubMed
    1. Astin M., Griffin T., Neal R.D., Rose P., Hamilton W. The diagnostic value of symptoms for colorectal cancer in primary care: A systematic review. Br. J. Gen. Pr. 2011;61:e231–e243. - PMC - PubMed
    1. Hristova N.R., Tagscherer K.E., Fassl A., Kopitz J., Roth W. Notch1-dependent regulation of p27 determines cell fate in colorectal cancer. Int. J. Oncol. 2013;43:1967–1975. - PubMed

Publication types

MeSH terms

LinkOut - more resources