. 2014 May 14;9(5):e97477.
doi: 10.1371/journal.pone.0097477. eCollection 2014.

Lipid accumulation during the establishment of kleptoplasty in Elysia chlorotica

Affiliations

Lipid accumulation during the establishment of kleptoplasty in Elysia chlorotica

Karen N Pelletreau et al. PLoS One. .

Abstract

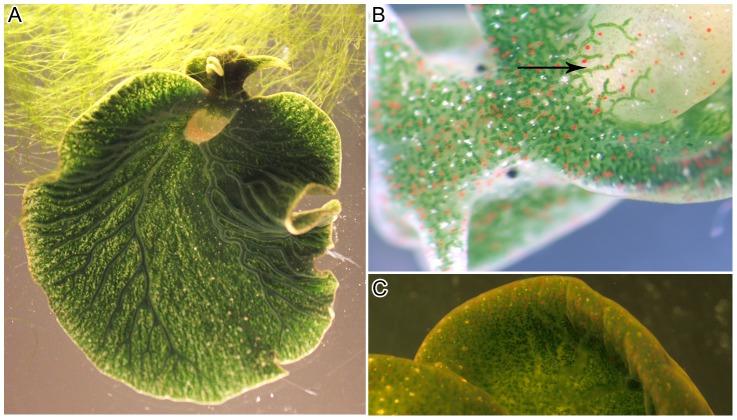
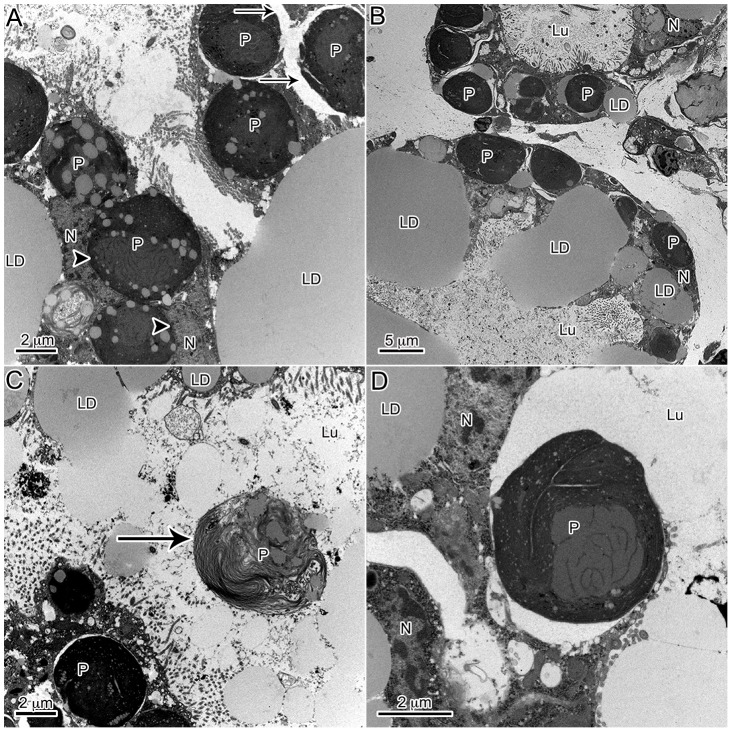
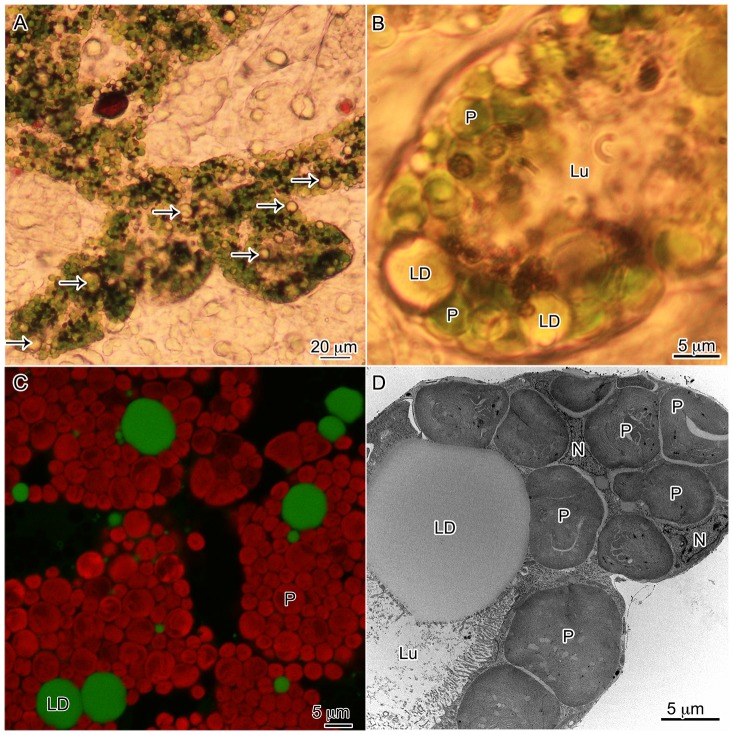
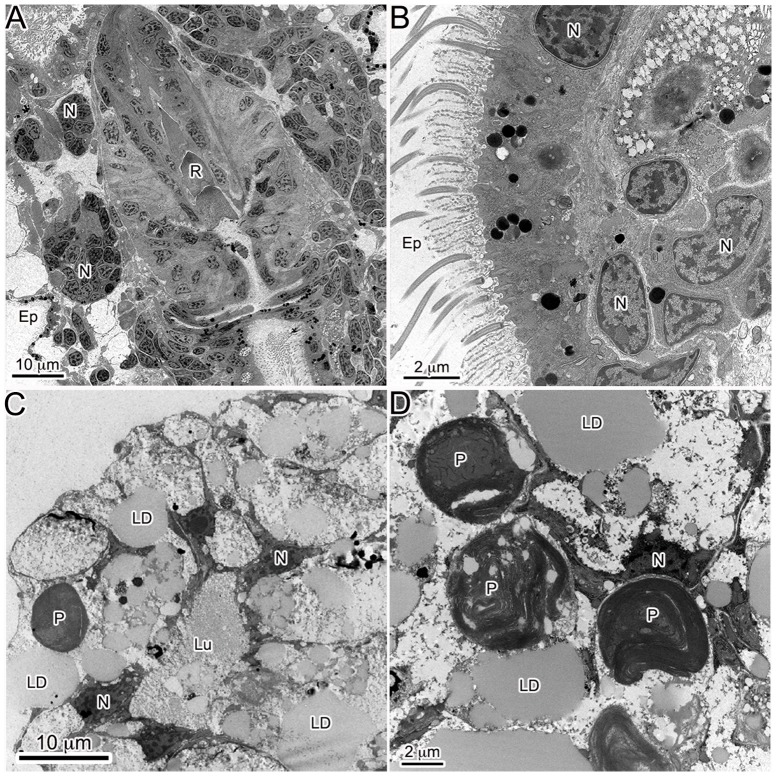
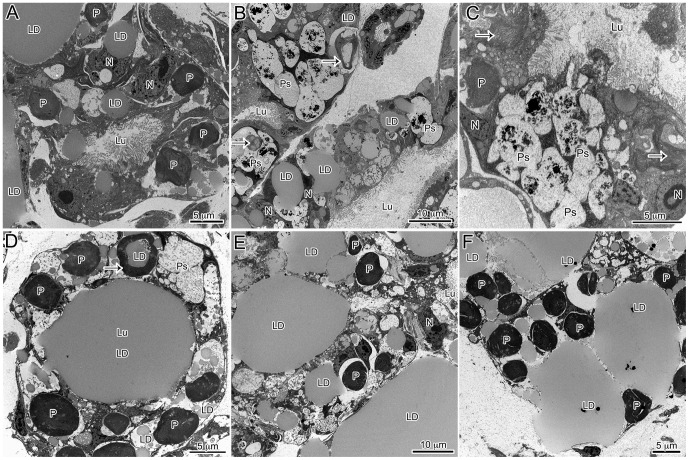
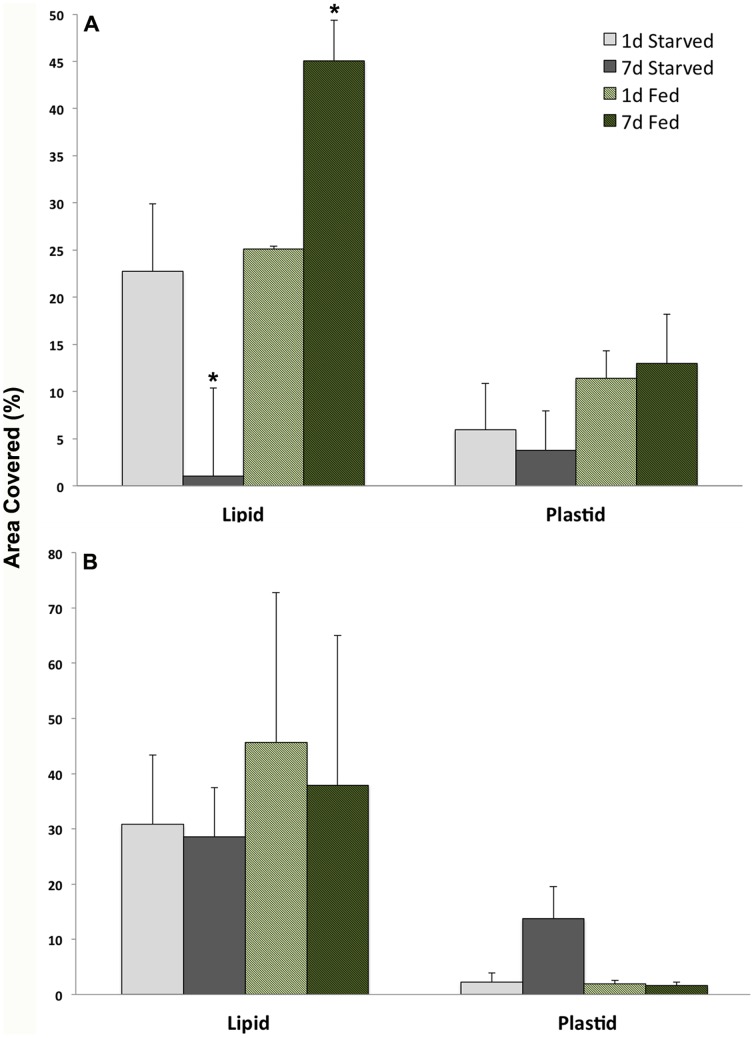
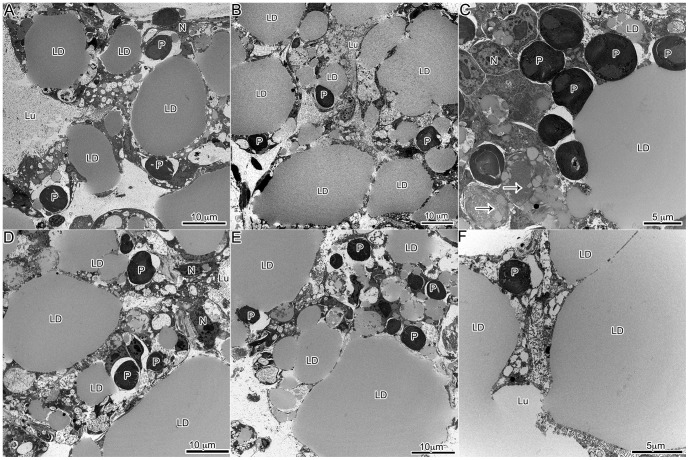
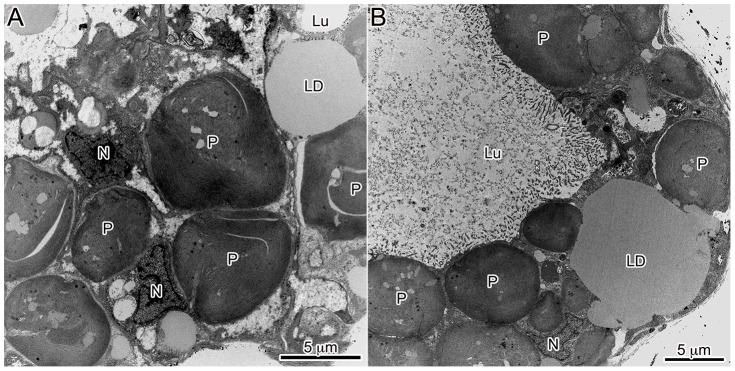
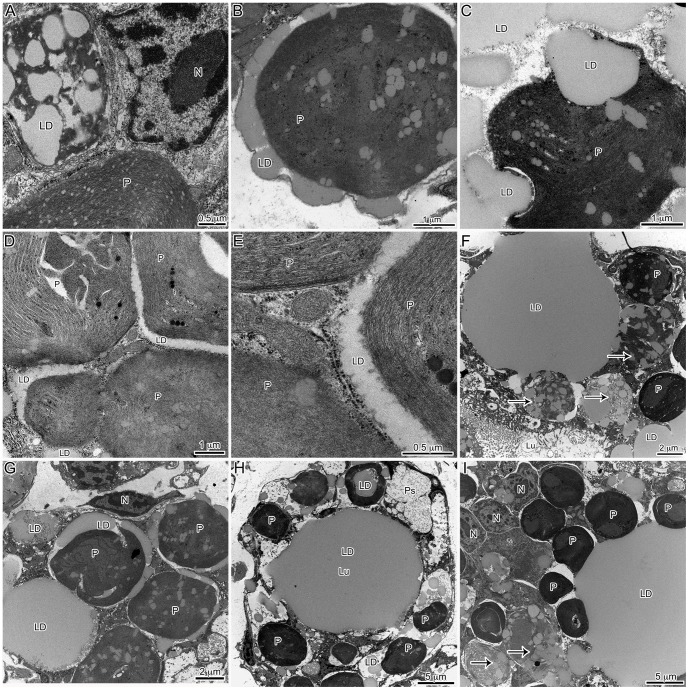
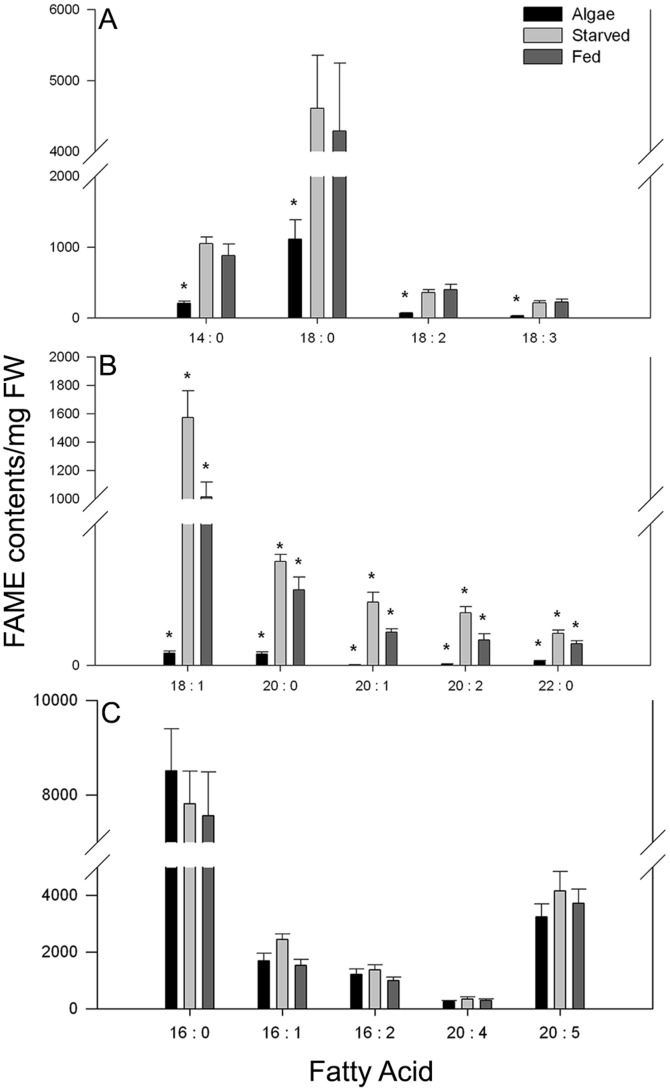
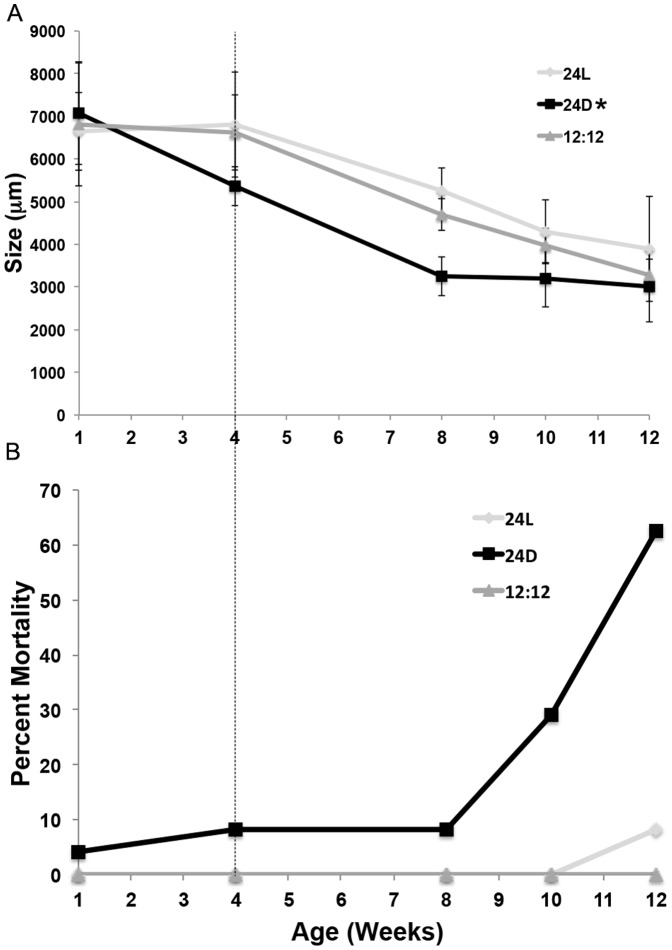
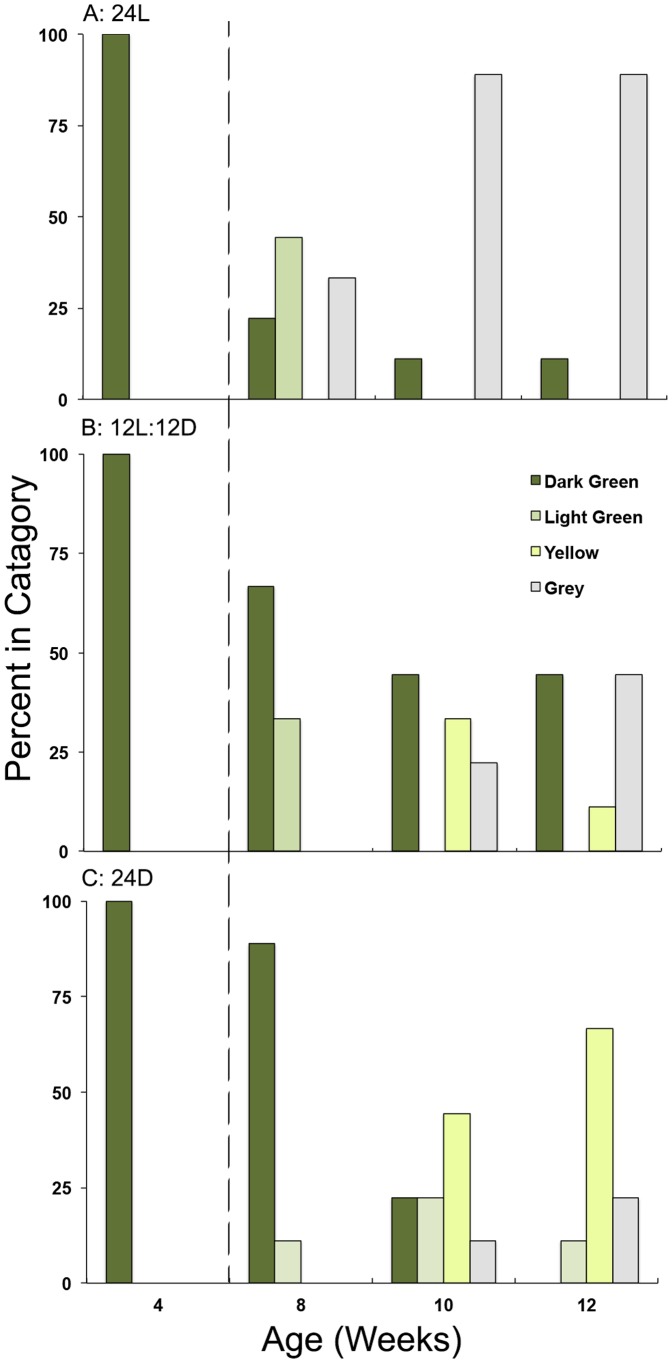
The establishment of kleptoplasty (retention of "stolen plastids") in the digestive tissue of the sacoglossan Elysia chlorotica Gould was investigated using transmission electron microscopy. Cellular processes occurring during the initial exposure to plastids were observed in laboratory raised animals ranging from 1-14 days post metamorphosis (dpm). These observations revealed an abundance of lipid droplets (LDs) correlating to plastid abundance. Starvation of animals resulted in LD and plastid decay in animals <5 dpm that had not yet achieved permanent kleptoplasty. Animals allowed to feed on algal prey (Vaucheria litorea C. Agardh) for 7 d or greater retained stable plastids resistant to cellular breakdown. Lipid analysis of algal and animal samples supports that these accumulating LDs may be of plastid origin, as the often algal-derived 20∶5 eicosapentaenoic acid was found in high abundance in the animal tissue. Subsequent culturing of animals in dark conditions revealed a reduced ability to establish permanent kleptoplasty in the absence of photosynthetic processes, coupled with increased mortality. Together, these data support an important role of photosynthetic lipid production in establishing and stabilizing this unique animal kleptoplasty.


Conflict of interest statement

Competing Interests: The authors have declared that no competing interests exist.

Figures

Figure 1
Figure 1. Anatomy of the sacoglossan mollusc Elysia chlorotica.
(A) Sea slug consuming its obligate algal food Vaucheria litorea. Small, punctate green circles are the plastids located within the extensive digestive diverticula of the animal. (B) A defined tubule of the digestive diverticula extending into the parapodial region of the animal (arrow). The digestive system consists of densely packed tubules that branch throughout the animal's body. Each tubule is made up of a layer of single cells containing animal organelles and numerous algal plastids. This cell layer surrounds the lumen. (C) Magnified image of the epidermis of E. chlorotica showing densely packed plastids. The animals are light grey in color without their resident plastids, which contribute chlorophyll to render the sea slugs bright green.
Figure 2
Figure 2. General observations of plastid dynamics within the digestive diverticula of E. chlorotica developing juveniles (<9 dpm).
Many cellular observations in juveniles were in agreement with historical work on adult E. chlorotica, with the notable exception of massive LD accumulation in juvenile animals. (A) Numerous plastids accumulated within the cells of the digestive diverticula both surrounded by a membrane (arrow) or in apparent direct contact with the host cytosol (arrowhead). (B) Accumulation of the plastids corresponded with lipids, while the lumen of the animals remained relatively clear of debris. (C) A rare degraded plastid (arrow) observed within the lumen. (D) One rare example of potential phagocytosis of an algal plastid by the digestive cells. LD: lipid droplet, P: plastid, Lu: lumen, N: E. chlorotica nucleus.
Figure 3
Figure 3. Lipid droplets in the digestive diverticula of E. chlorotica as observed using light (A,B) confocal (C) and transmission electron (D) microscopy.
Green fluorescence in panel C is from the neutral lipid fluorescent label BODIPY 505/515 (Molecular Probes) verifying these abundant refractive bodies as lipids, and the red is chlorophyll autofluorescence. Animals in these image range in age from 4 dpm (A,B) to >6 months (C,D). Arrows (A) and LD: lipid droplet, P: plastid, Lu: lumen, N: E. chlorotica nucleus.
Figure 4
Figure 4. Transmission electron micrographs of E. chlorotica illustrating the acquisition of both lipids and plastids upon feeding.
(A,B) Aposymbiotic E. chlorotica at 1 dpm with neither plastids or lipids present in the digestive tissue. (C,D) Fed E. chlorotica at 1 dpm with large lipid accumulation and visible intracellular plastids. LD: lipid droplet, P: plastid, Lu: lumen, N: E. chlorotica nucleus, Ep: epidermis, R: radula.
Figure 5
Figure 5. Representative images of the digestive diverticula of juvenile E. chlorotica allowed to feed on V. litorea for 5 days prior to being starved of food ( =  transient kleptoplasty).
Animals were starved for 1 day (A), 3 days (B) or 7 days (C). The same age control animals, allowed to feed continuously, are in the corresponding position in the bottom panels (D–F). Plastid decay and LD degradation are apparent in the animals removed from food in comparison to the same age controls. LD: Lipid droplet, P: plastid, Lu: lumen, N: E. chlorotica nucleus, Ps: phagosome; arrows indicate decaying plastids, black marks in F are staining artifacts.
Figure 6
Figure 6. Differences in the percent cover of lipids and plastids based on area in TEMs of animals exhibiting transient and permanent kleptoplasty.
(A) Percent cover (mean ± SD) of lipids and plastids from micrographs (n = 3) of animals fed 5 d (transient kleptoplasty) and then starved for 1 or 7 d (grey bars) compared to same age control animals fed continuously (green bars). (B) Percent cover (mean ± SD) of lipids and plastids from micrographs (n = 3) of animals fed 7 d (permanent kleptoplasty) and then starved for 1 or 7 d (grey bars) compared to control animals the same age but fed continuously (green bars). Asterisks indicate significantly different means (Welch's t-test; p = 0.05).
Figure 7
Figure 7. Representative images of the digestive diverticula of juvenile E. chlorotica allowed to feed on V. litorea for 7 days prior to being starved of food ( =  permanent kleptoplasty).
Animals were starved for 1(A), 3 d (B) or 7 d (C). The same age control animals, allowed to feed continuously, are in the corresponding position in the bottom panels (D–F). Starved and fed animals show very similar patterns. LD: lipid droplet, P: plastid, Lu: lumen, N: E. chlorotica nucleus; arrows indicate decaying plastids.
Figure 8
Figure 8. Adult E. chlorotica (reared in the laboratory for 11 months and fed V. litorea) were used to compare the effects of food removal on the digestive diverticula of mature individuals.
Starvation of adult animals showed no obvious reduction in lipid or plastid content. (A) Adult animal starved for 2 wk. (B) Adult animal fed continuously. LD: lipid droplet, P: plastid, Lu: lumen, N: E. chlorotica nucleus.
Figure 9
Figure 9. Representative TEM images of LD dynamics during the initial 2E. chlorotica suggesting the source of lipid accumulation in the animal is the algal plastids.
All images are of fed controls. Accumulation of LD within the plastids is visible in every panel, but most clearly in A–C. Exudation of lipids from the plastids is suggested by panels B–G. Accumulation of large intracellular LD is illustrated in F and G, and intra-lumenal LD in H and I. LD: lipid droplet, P: plastid, Lu: lumen, N: E. chlorotica nucleus; arrows indicate decaying plastids.
Figure 10
Figure 10. Fatty acid profile of V. litorea (alga) and adult E. chlorotica fed regularly (Fed) or starved for 2 wk (Starved) as determined by FAME analysis (FAME contents/mg FW, normalized to 17∶0 internal standard).
(A) Fatty acids that were significantly lower in the alga than in either fed or starved animals. (B) Fatty acids that were significantly variable between all three samples. (C) Fatty acids that showed no significant difference between algal and animal samples. Asterisk indicate significance; ANOVA p<0.05.
Figure 11
Figure 11. Growth rate (A) and mortality (B) of animals raised in either 24L, 12L∶12D or 24D conditions and provided V. litorea for 4 wk before starvation (indicated by the dotted line).
(A) Mean length (± SE) of animals (n = 9, representing those animals still viable after 12 wk of starvation) after 4 wk of feeding and then 4, 6 and 8 wk of subsequent starvation in the light conditions indicated. Asterisk indicates a significant effect of treatment over time in animals starved in dark conditions relative to animals starved in the light (ANOVAR, Huyn-Feldt correction p = 0.005). (B) Percent mortality observed in the three treatment groups (n = 24, representing all replicates) over the course of the 12 wk. Mortality in the 24D reared animals was greater than in the other two treatments.
Figure 12
Figure 12. Representative pigment composition of animals that were raised in A) 24L, B) 12L∶12D, or C) 24D conditions and provided V. litorea for 4 wk before starvation for 4,6, and 8 wk.
Animals were scored based on a color rubric ranging from dark green to grey, with movement away from dark green indicative of loss of plastids. There was a greater percentage of animals observed with pigment loss in the 24D (C) and 24L (A) conditions, than in 12L∶12D (B). Dotted line indicates when food was removed from all treatments.

Similar articles

Cited by

References

    1. Trench RK (1975) Of “leaves that crawl”: functional chloroplasts in animal cells. Symp Soc Exp Biol: 229–265. - PubMed
    1. Rumpho ME, Dastoor F, Manhart J, Lee J (2006) The kleptoplast. In: Wise RR, Hoober JK, editors. The structure and function of plastids.New York: Advances in Photosynthesis and Respiration, Vol. 23 . pp. 451–473. doi:10.1007/978-1-4020-4061-0_23.
    1. Rumpho ME, Pelletreau KN, Moustafa A, Bhattacharya D (2011) The making of a photosynthetic animal. J Exp Biol 214: 303–311 10.1242/jeb.046540 - DOI - PMC - PubMed
    1. Clark K, Jensen K, Stirts H (1990) Survey for functional kleptoplasty (chloroplast symbiosis) among West Atlantic Ascoglossa (Sacoglossa). Veliger 33: 339–345.
    1. Green BJ, Li WY, Manhart JR, Fox TC, Summer EJ, et al. (2000) Mollusc-algal chloroplast endosymbiosis. Photosynthesis, thylakoid protein maintenance, and chloroplast gene expression continue for many months in the absence of the algal nucleus. Plant Physiol 124: 331–342. - PMC - PubMed

Publication types