. 2014 Nov;51(5):688-700.
doi: 10.1165/rcmb.2013-0363OC.

FOXJ1 prevents cilia growth inhibition by cigarette smoke in human airway epithelium in vitro

Affiliations

FOXJ1 prevents cilia growth inhibition by cigarette smoke in human airway epithelium in vitro

Angelika Brekman et al. Am J Respir Cell Mol Biol. 2014 Nov.

Abstract

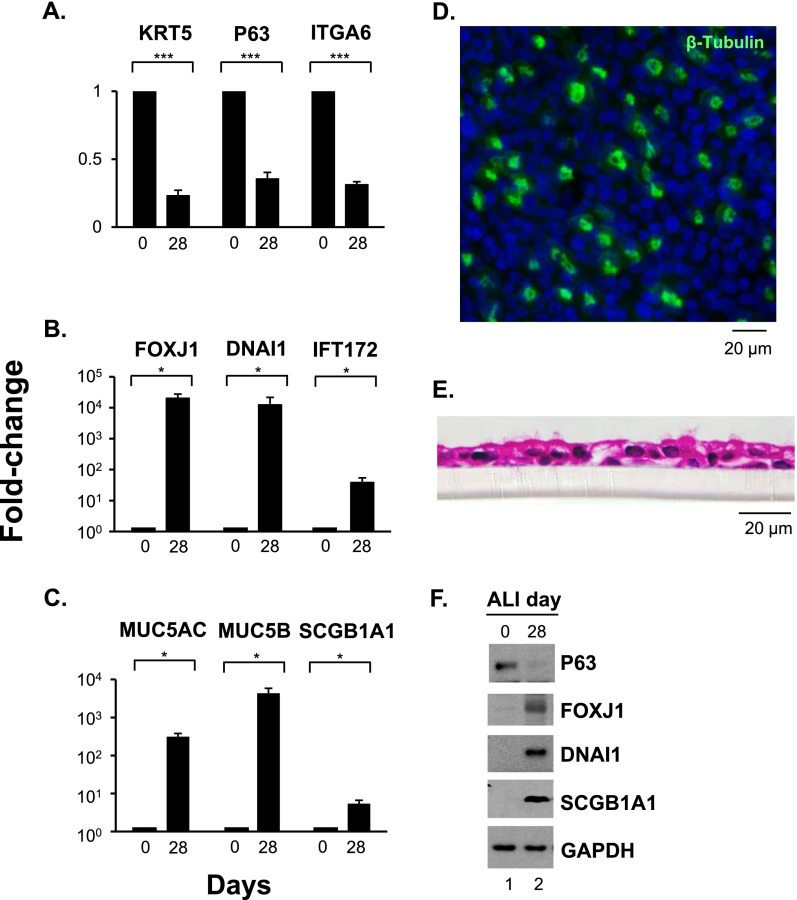
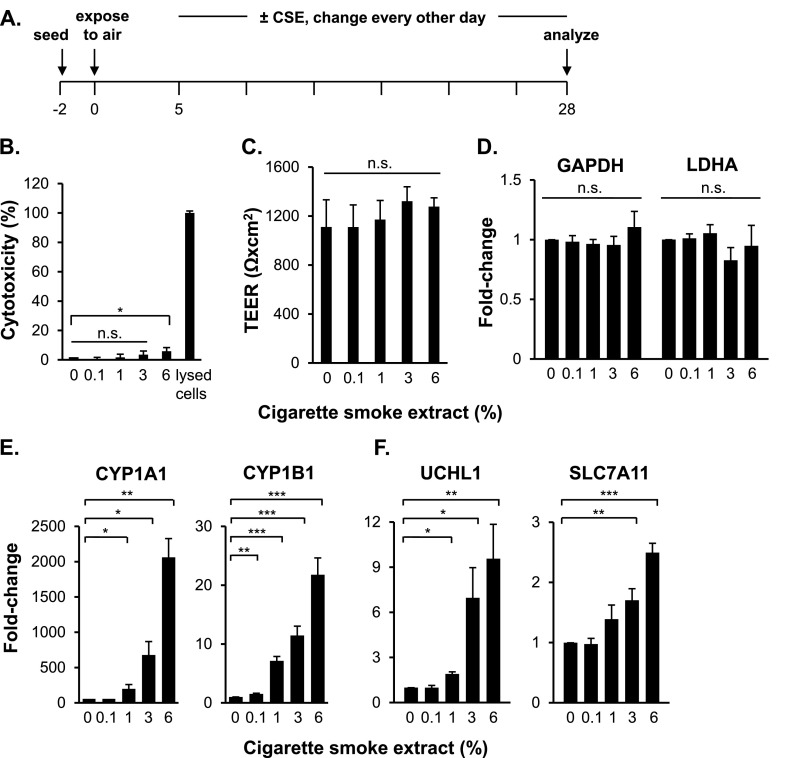
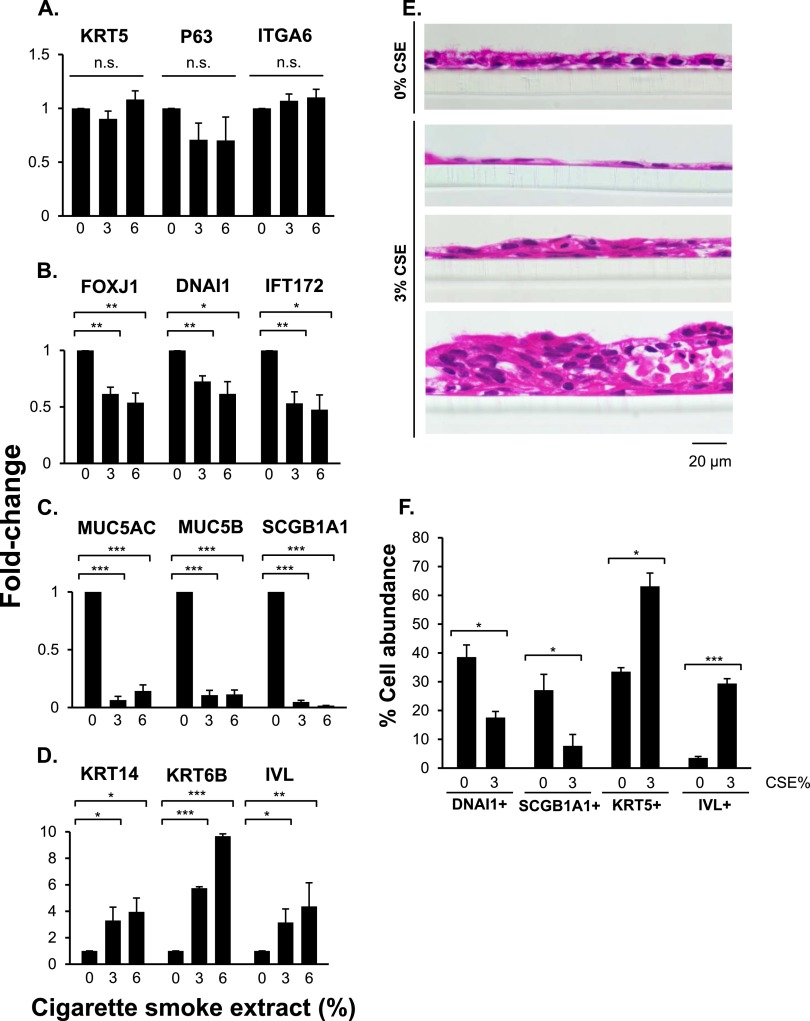
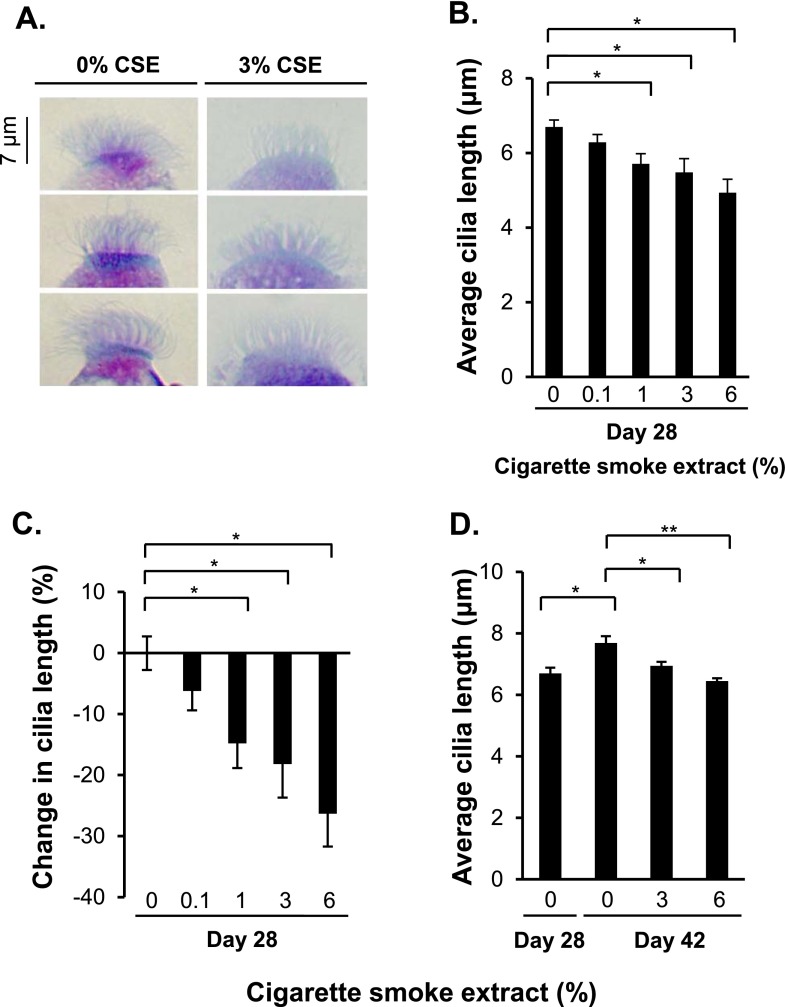
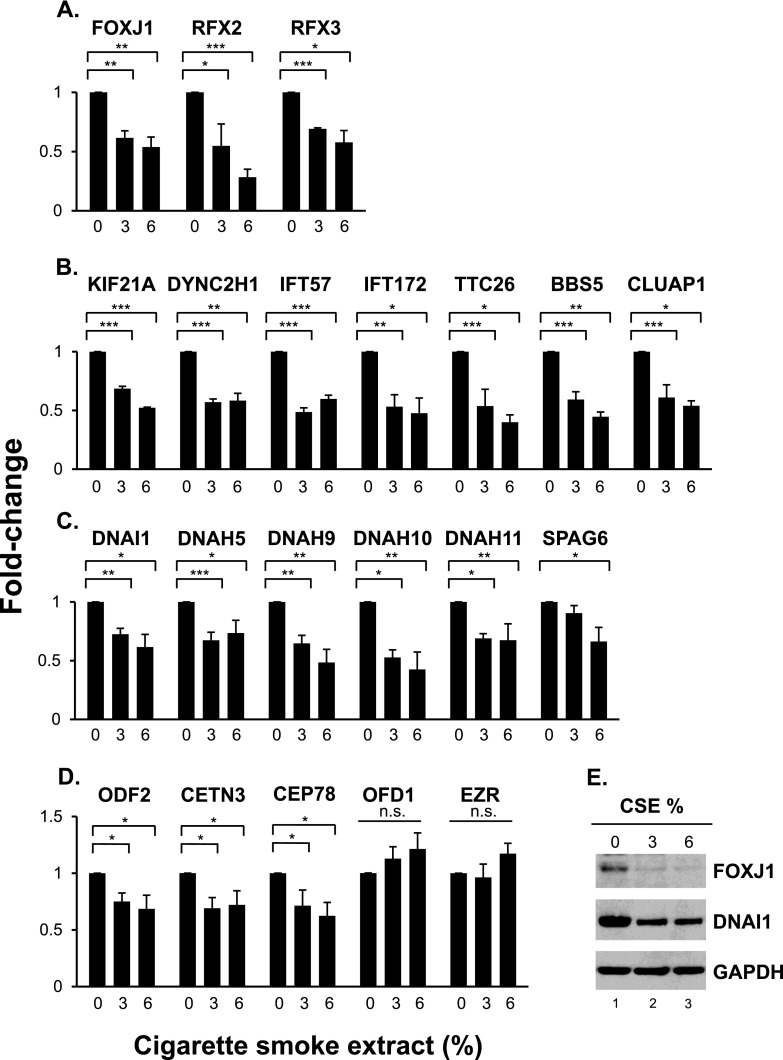
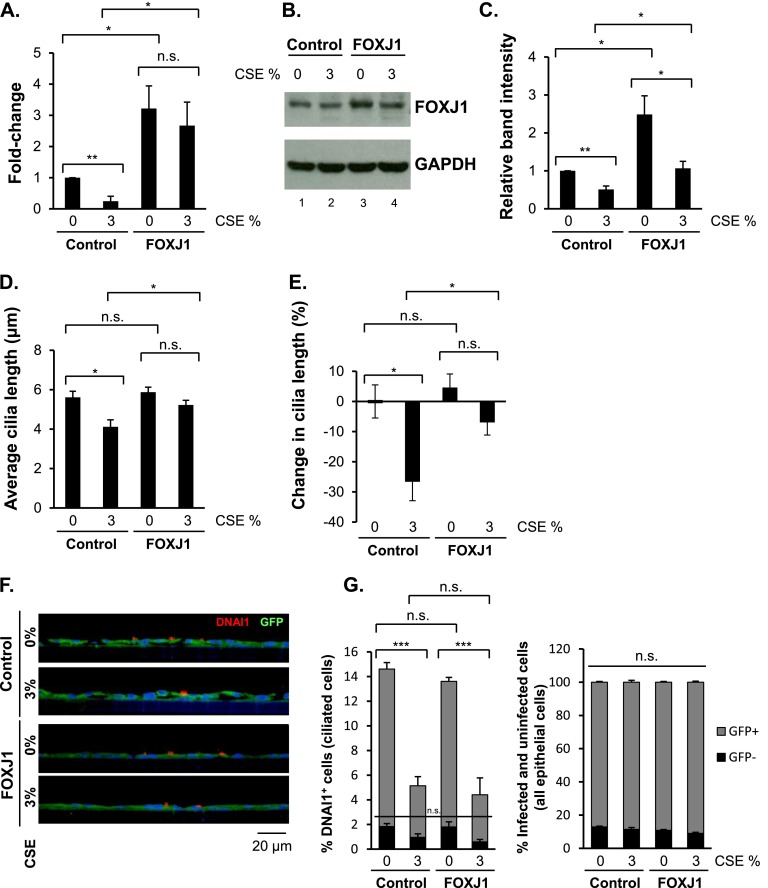
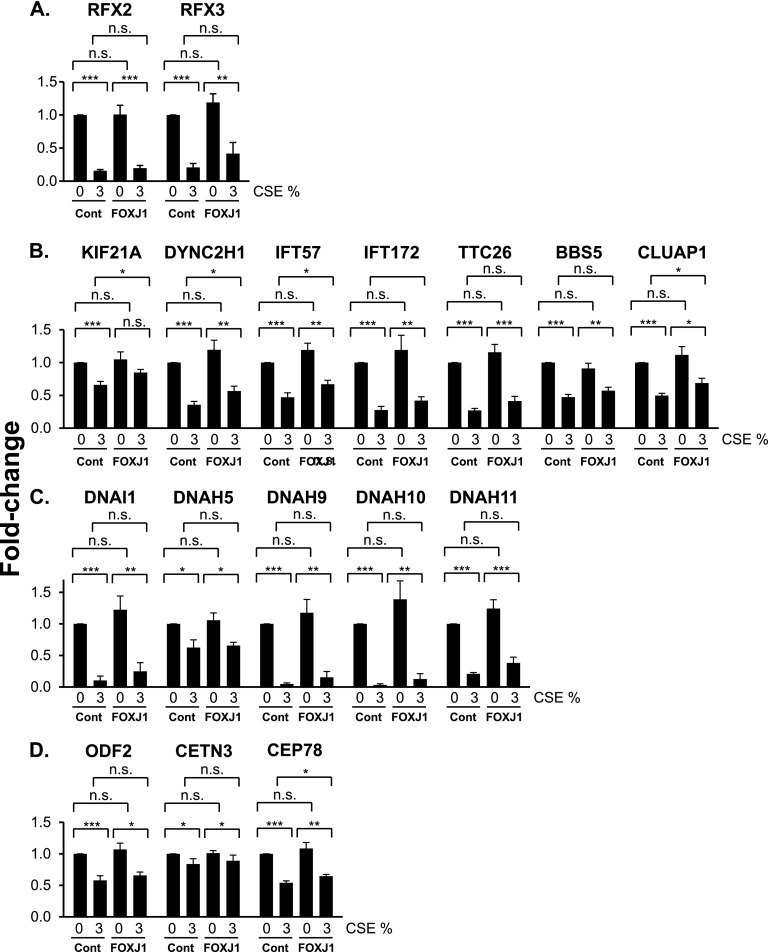
Airway epithelium ciliated cells play a central role in clearing the lung of inhaled pathogens and xenobiotics, and cilia length and coordinated beating are important for airway clearance. Based on in vivo studies showing that the airway epithelium of healthy smokers has shorter cilia than that of healthy nonsmokers, we investigated the mechanisms involved in cigarette smoke-mediated inhibition of ciliogenesis by assessing normal human airway basal cell differentiation in air-liquid interface (ALI) cultures in the presence of nontoxic concentrations of cigarette smoke extract (CSE). Measurements of cilia length from Day 28 ALI cultures demonstrated that CSE exposure was associated with shorter cilia (P < 0.05), reproducing the effect of cigarette smoking on cilia length observed in vivo. This phenotype correlated with a broad CSE-mediated suppression of genes involved in cilia-related transcriptional regulation, intraflagellar transport, cilia motility, structural integrity, and basal body development but not of control genes or epithelial barrier integrity. The CSE-mediated inhibition of cilia growth could be prevented by lentivirus-mediated overexpression of FOXJ1, the major cilia-related transcription factor, which led to partial reversal of expression of cilia-related genes suppressed by CSE. Together, the data suggest that components of cigarette smoke are responsible for a broad suppression of genes involved in cilia growth, but, by stimulating ciliogenesis with the transcription factor FOXJ1, it may be possible to maintain close to normal cilia length despite the stress of cigarette smoking.

Keywords: cigarette smoke; ciliogenesis.


Figures

Figure 1.
Figure 1.
Differentiation of human airway basal cells in air–liquid interface (ALI) cultures. (AC) TaqMan PCR analyses of differentiation-related genes from Day 0 and Day 28 ALI cultures. Basal cell genes (KRT5, P63, ITGA6) (A), ciliated cell genes (FOXJ1, DNAI1, IFT172) (B), and secretory cell genes (MUC5AC, MUC5B, SCGB1A1) (C). Averages and standard errors of three independent experiments are shown. P values were determined by two-tailed Student's t test. *P < 0.05; ***P < 0.001. (D) Immunofluorescent staining of ciliated cell marker β-tubulin IV (green) in Day 28 ALI cultures; cell nuclei stained with DAPI. Bar, 20 μm. (E) Hematoxylin and eosin staining of paraffin-embedded section of Day 28 ALI cultures. Bar, 20 μm. (F) Western analysis. Shown is expression of P63, FOXJ1, DNAI1, and SCGB1A1 proteins in whole cell lysates of Day 0 and Day 28 ALI cultures. Glyceraldehyde 3-phosphate dehydrogenase (GAPDH) was used as a loading control. Data in DF are representative of three independent experiments.
Figure 2.
Figure 2.
Effect of cigarette smoke extract (CSE) on ALI cultures. (A) Experimental design. ALI cultures were exposed to 0, 0.1, 1, 3, and 6% CSE between Days 5 and 28 from the basolateral side of the transwell inserts. Medium was changed every 2 to 3 days, with fresh CSE added. (B) Viability. Assessment at Day 28 by lactate dehydrogenase release assay. (C) Barrier integrity. Shown is the effect of CSE on transepithelial electrical resistance (TEER) (expressed in Ω × cm2) in untreated and CSE-treated Day 28 ALI cultures. Data in B and C represent averages and standard errors of three independent experiments. P values were determined by two-tailed Student's t test. *P < 0.05. n.s., nonsignificant (P > 0.05). (DF) TaqMan PCR analyses of housekeeping genes (GAPDH, lactate dehydrogenase A [LDHA]), oxidative stress genes (CYP1A1, CYP1B1), and smoking-induced genes (UCHL1, SLC7A11) in Day 28 ALI cultures. Averages and standard errors of three independent experiments are shown. P values were determined by two-tailed Student’s t test. *P < 0.05, **P < 0.01, and ***P < 0.001. n.s., nonsignificant (P > 0.05).
Figure 3.
Figure 3.
Effect of CSE on human airway basal cells differentiation in ALI cultures. Cells were differentiated in ALI cultures while being exposed to 0, 3, and 6% of CSE between Days 5 and 28. (AD) TaqMan PCR analyses of differentiation-related genes at Day 28 of ALI cultures. Basal cell genes (KRT5, P63, ITGA6) (A), ciliated cell genes (FOXJ1, DNAI1, IFT172) (B), secretory cell genes (MUC5AC, MUC5B, SCGB1A1) (C), and squamous cell genes (KRT14, KRT6B, IVL) (D). Averages and standard errors of three independent experiments are shown. P values were determined by two-tailed Student's t test. *P < 0.05, **P < 0.01, and ***P < 0.001. (E) Hematoxylin and eosin staining of paraffin-embedded sections of Day 28 ALI cultures treated with 0 and 3% CSE. Bar, 20 μm. (F) Quantitative assessment of basal cells (KRT5+), ciliated cells (DNAI1+), secretory cells (SCGB1A1+), and squamous cells (IVL+) in ALI cultures. The percentage of basal, ciliated, secretory, and squamous cells was determined by counting the different epithelial cells, visualized by immunofluorescent or Alcian blue staining of ALI sections (representative images are shown in Figure E1) and dividing those values by the total number of cells, determined by counting the DAPI-stained nuclei in the same field. Shown are averages of means and standard errors of three independent experiments. P values were determined by two-tailed Student's t test. *P < 0.05; ***P < 0.001.
Figure 4.
Figure 4.
Suppression of ciliogenesis in cells differentiating in ALI cultures in the presence of CSE. Cells were differentiated in ALI cultures while being exposed to 0, 0.1, 1, 3, and 6% of CSE between Days 5 and 28. (A) Examples of the effect of CSE on cilia length. On Day 28 of ALI culture, suspensions of differentiated cells were applied to glass slides using a cytocentrifuge, air dried, and stained with Diff-Quik. Shown are representative images of cilia in 0 and 3% CSE-treated ALI cultures from three independent experiments. Bar, 7 μm. (B) Quantitative assessment of cilia length in untreated and CSE-treated Day 28 ALI cultures. Shown are means and standard errors of three independent experiments; in each experiment, 10 cilia on 10 different ciliated cells were measured (100 measurements in total per experiment) in 60× images of Diff-Quik–stained cytospins using ImageJ software. (C) Average percent decrease in cilia length. The average cilia length in untreated Day 28 ALI cultures was set to 100%, and the average cilia length in the CSE-treated Day 28 ALI cultures was normalized to the untreated values. (D) Effect of CSE on cilia length when ALI cultures continued beyond 28 days. Quantitative assessment of cilia length of untreated (Days 28 and 42) and CSE-treated cells (ALI cultures treated with 0, 3, and 6% of CSE between Days 28 and 42). Cilia lengths were determined using same methods as in B. In BD, averages and standard errors of three independent experiments are shown. P values were determined by two-tailed Student’s t test. *P < 0.05 and **P < 0.01.
Figure 5.
Figure 5.
CSE-mediated suppression of the cilia-related transcriptional program in differentiating ALI cultures. (AD) TaqMan PCR analysis of cilia-related genes. Cilia-related transcription factors (FOXJ1, RFX2, RFX3) (A), intraflagellar transport (KIF21A, DYNC2H1, IFT57, IFT172, TTC26, BBS5, CLUAP1) (B), motility and structural integrity (DNAI1, DNAH5, DNAH9, DNAH10, DNAH11, SPAG6) (C), and basal body development (ODF2, CETN3, CEP78, OFD1, EZR) (D). Cells were differentiated in ALI cultures while being exposed to 0, 3, and 6% of CSE between Days 5 and 28. Averages and standard errors of three independent experiments are shown. P values were determined by two-tailed Student’s t test. *P < 0.05, **P < 0.01, and ***P < 0.001. n.s., nonsignificant (P > 0.05). (E) Western analysis of FOXJ1 and DNAI1 proteins in whole cell lysates of Day 28 ALI cultures treated with 0, 3, and 6% CSE. GAPDH was used as a loading control. Western analyses were representative of three independent experiments.
Figure 6.
Figure 6.
Prevention of CSE-mediated suppression of cilia growth by FOXJ1 overexpression. Basal cells infected with Lenti-control or Lenti-FOXJ1 lentiviruses were differentiated in ALI cultures while being exposed to 0 and 3% CSE between Days 5 and 28. (A) TaqMan PCR analysis of FOXJ1 gene expression in Day 28 ALI cultures. Averages and standard errors of three independent experiments are shown. P values were determined by two-tailed Student’s t test. *P < 0.05. n.s., nonsignificant (P > 0.05). (B) Western analysis of FOXJ1 protein in whole cell lysates of Day 28 ALI cultures. GAPDH was used as a loading control. Representative Western analysis of three independent experiments is shown. (C) Quantification of relative band intensities of FOXJ1 protein in Western analysis from three independent experiments. FOXJ1 and GAPDH band intensities were quantified using ImageJ software followed by normalization of FOXJ1 to the GAPDH values. Averages and standard errors of three independent experiments are shown. P values were determined by two-tailed Student’s t test. *P < 0.05; **P < 0.01. (D) Quantitative assessment of cilia length in Day 28 ALI cultures. Shown are means and standard errors of three independent experiments, where in each experiment 10 cilia on 10 different ciliated cells were measured (100 measurements in total per experiment). Suspensions of differentiated cells were applied to glass slides using cytocentrifuge and were air dried. Slides were stained for GFP protein by immunohistochemistry, and cilia were measured in GFP-positive ciliated cells only. Cilia were measured in 60× images of stained cytospins using ImageJ software. (E) Average percent decrease in cilia length. The average cilia length in 0% CSE-treated Day 28 ALI cultures infected with Lenti-control was set to 100%, and the average cilia lengths in the subsequent samples were normalized to that value. (F) Representative immunofluorescence images of ciliated cell marker DNAI1 (red) and GFP (green) in Day 28 Lenti-control–infected and Lenti-FOXJ1–infected ALI cultures treated with 0 and 3% CSE. Cell nuclei were stained with DAPI. Bar, 20 μm. (G) Quantitative assessment of % DNAI1-positive, GFP-positive and DNAI1-positive, GFP-negative cells (infected and uninfected ciliated cells) and GFP-positive and GFP-negative cells (infected and uninfected epithelial cells) in Lenti-control–infected and Lenti-FOXJ1–infected ALI cultures treated with 0 and 3% CSE. For ciliated cell detection, DNAI1 antibody was used; for lentivirus infected cell detection, GFP antibody was used (representative images are shown in F). The percentage of specific cells for each condition was determined by counting the DNAI1-positive cells (ciliated cells) in ALI culture sections, visualized by immunofluorescence staining, and dividing those values by the total number of cells, determined by counting the DAPI-stained nuclei in the same field (in total, 500 cells were counted for each condition per experiment). Shown are averages of means and standard errors of three independent experiments. P values were determined by two-tailed Student's t test. ***P < 0.001. n.s., nonsignificant (P > 0.05).
Figure 7.
Figure 7.
Effect of FOXJ1 overexpression on CSE-mediated suppression of cilia-related gene expression. Basal cells, infected with Lenti-control or Lenti-FOXJ1 lentiviruses, were differentiated in ALI cultures while being exposed to 0 and 3% CSE between Days 5 and 28. Shown is TaqMan PCR analysis of cilia-related genes. (A) Cilia-related transcription factors (RFX2, RFX3). (B) Intraflagellar transport (KIF21A, DYNC2H1, IFT57, IFT172, TTC26, BBS5, CLUAP1). (C) Motility and structural integrity (DNAI1, DNAH5, DNAH9, DNAH10, DNAH11). (D) Basal body development (ODF2, CETN3, CEP78). Averages and standard errors of five independent experiments are shown. P values were determined by two-tailed Student’s t test. *P < 0.05, **P < 0.01, and ***P < 0.001. n.s., nonsignificant (P > 0.05).

Similar articles

Cited by

References

    1. Lee RMKW, Forrest JB.Structure and function of ciliaCrystal RGeditor. The lung: scientific foundations2nd ed.. Philadelphia, PA: Lippincott-Raven Publishers; 1997459–478.
    1. Wanner A, Salathé M, O’Riordan TG. Mucociliary clearance in the airways. Am J Respir Crit Care Med. 1996;154:1868–1902. - PubMed
    1. Livraghi A, Randell SH. Cystic fibrosis and other respiratory diseases of impaired mucus clearance. Toxicol Pathol. 2007;35:116–129. - PubMed
    1. Fahy JV, Dickey BF. Airway mucus function and dysfunction. N Engl J Med. 2010;363:2233–2247. - PMC - PubMed
    1. Ostrowski LE, Blackburn K, Radde KM, Moyer MB, Schlatzer DM, Moseley A, Boucher RC. A proteomic analysis of human cilia: identification of novel components. Mol Cell Proteomics. 2002;1:451–465. - PubMed

Publication types

MeSH terms

Substances

LinkOut - more resources