. 2014 Jul 11;289(28):19508-18.
doi: 10.1074/jbc.M113.529966. Epub 2014 May 14.

Thymosin β4 up-regulation of microRNA-146a promotes oligodendrocyte differentiation and suppression of the Toll-like proinflammatory pathway

Affiliations

Thymosin β4 up-regulation of microRNA-146a promotes oligodendrocyte differentiation and suppression of the Toll-like proinflammatory pathway

Manoranjan Santra et al. J Biol Chem. .

Abstract

Thymosin β4 (Tβ4), a G-actin-sequestering peptide, improves neurological outcome in rat models of neurological injury. Tissue inflammation results from neurological injury, and regulation of the inflammatory response is vital for neurological recovery. The innate immune response system, which includes the Toll-like receptor (TLR) proinflammatory signaling pathway, regulates tissue injury. We hypothesized that Tβ4 regulates the TLR proinflammatory signaling pathway. Because oligodendrogenesis plays an important role in neurological recovery, we employed an in vitro primary rat embryonic cell model of oligodendrocyte progenitor cells (OPCs) and a mouse N20.1 OPC cell line to measure the effects of Tβ4 on the TLR pathway. Cells were grown in the presence of Tβ4, ranging from 25 to 100 ng/ml (RegeneRx Biopharmaceuticals Inc., Rockville, MD), for 4 days. Quantitative real-time PCR data demonstrated that Tβ4 treatment increased expression of microRNA-146a (miR-146a), a negative regulator the TLR signaling pathway, in these two cell models. Western blot analysis showed that Tβ4 treatment suppressed expression of IL-1 receptor-associated kinase 1 (IRAK1) and tumor necrosis factor receptor-associated factor 6 (TRAF6), two proinflammatory cytokines of the TLR signaling pathway. Transfection of miR-146a into both primary rat embryonic OPCs and mouse N20.1 OPCs treated with Tβ4 demonstrated an amplification of myelin basic protein (MBP) expression and differentiation of OPC into mature MBP-expressing oligodendrocytes. Transfection of anti-miR-146a nucleotides reversed the inhibitory effect of Tβ4 on IRAK1 and TRAF6 and decreased expression of MBP. These data suggest that Tβ4 suppresses the TLR proinflammatory pathway by up-regulating miR-146a.

Keywords: Actin; MicroRNA (miRNA); Myelin; Oligodendrocyte; Toll-like Receptor (TLR).


Figures

FIGURE 1.
FIGURE 1.
Immunostaining of primary rat embryonic OPCs. Primary rat embryonic OPCs were immunostained for O4 labeled with fluorescence Cy3 and counterstained for nuclei with DAPI. The cells were quantified by counting the percentage of O4-positive cells when DAPI-positive cells were considered as the total number of cells (shown at the bottom). Scale bar, 100 μm.
FIGURE 2.
FIGURE 2.
MicroRNA analysis of miR-146a and miR-146b in OPCs after Tβ4 treatment by qrtPCR. The total RNA samples were extracted from primary rat embryonic OPCs (left) and mouse OPC cell line N20.1 (right) after treatment with Tβ4 at doses ranging from 0 to 100 ng/ml (shown at the bottom) and after transfection with miR-146a for microRNA analysis of miR-146a (A) and miR-146b (B) by qrtPCR. Note that expression of miR-146a was increased in a dose-dependent manner in both OPCs. In contrast, expression of miR-146b remained unchanged. p < 0.05 was considered as significant.
FIGURE 3.
FIGURE 3.
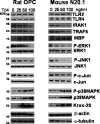
Western blot analysis of downstream signaling mediators of TLR in OPCs after Tβ4 treatment. The protein samples were separated, transferred, and analyzed from the primary rat embryonic OPCs (left) and mouse OPC cell line N20.1 (right) after treatment with Tβ4 at doses ranging from 0 to 100 ng/ml (shown at the top) and analyzed for different protein expressions. Migrations of proteins are shown at the right. The loading of the samples was normalized with β-actin and α-tubulin. Molecular mass markers are shown at the left in kDa. P-, phosphorylated.
FIGURE 4.
FIGURE 4.
Quantitative analysis of expression of TLR2, IRAK1, TRAF6, MBP, phosphorylated ERK1 (P-ERK1), ERK1, phosphorylated JNK1 (P-JNK1), JNK1, phosphorylated c-Jun (P-c-Jun), c-Jun, phosphorylated p38 MAPK (P-p38 MAPK), p38 MAPK, and Krox-20 (EGR2) at the protein level after Tβ4 treatment. Western blot data from the primary rat embryonic OPCs (O) and mouse OPC cell line N20.1 (N) after treatment with Tβ4 at doses of 0, 25, 50, and 100 ng/ml were quantified based on histogram analysis in comparison with α-tubulin. The bar graph indicates relative protein expression in comparison with α-tubulin. p < 0.05 was considered as significant.
FIGURE 5.
FIGURE 5.
Application of LPS inhibitor polymyxin B for analysis of MBP expression after Tβ4 treatment to test for confounding factor LPS contamination in Tβ4. The total RNA and protein samples were prepared from primary rat (n = 3) embryonic OPCs and mouse OPC cell line N20.1, which were cultured in the presence of polymyxin B (50 μg/ml) followed by treatment with Tβ4 at a dose of 50 and 100 ng/ml in three independent experiments. The bar graph (A) indicates relative mRNA expression in comparison with control for MBP in primary rat embryonic OPCs and mouse N20.1 cells. The protein samples were analyzed by Western blot (B). Loading of samples shown at the top was normalized with α-tubulin. Molecular mass markers are shown at the left in kDa. Migrations of proteins are shown at the right. The protein bands in Western blot were quantified based on histogram analysis in comparison with α-tubulin in the bar graph (C). p < 0.05 was considered as significant.
FIGURE 6.
FIGURE 6.
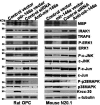
Effect of miR-146a and anti-miR-146a transfection on downstream signaling mediators of TLR. The primary rat embryonic OPCs (left) and mouse OPC cell line N20.1 (right) were transfected with control pcDNA3 vector, miR-146a expression (pcDNA3) vector, and control siRNA (Ambion) containing a random mixture of oligonucleotides for nucleotide control as a control for anti-miR-146a nucleotides (shown at the top) and were lysed for protein extraction and Western blot analysis. The loading of the samples was normalized with α-tubulin. Migrations of proteins are shown at the right. Molecular mass markers are shown at the left in kDa. P-, phosphorylated.
FIGURE 7.
FIGURE 7.
qrtPCR analysis of MBP, p38 MAPK, and Krox-20/EGR2 in OPCs. qrtPCR analysis of MBP, p38 MAPK, and Krox-20/EGR2 was performed in total RNA samples extracted from the following transfected primary rat embryonic OPCs (Rat OPCs) and mouse OPC cell line N20.1 (shown at the bottom). These cells were transfected with control plasmid (plasmid control) and miR-146a vector (miR-146a transfection), followed by treatment without and with Tβ4 (100 ng/ml) (miR-146a + Tβ4). These OPCs were also transfected with anti-miR-146a and Tβ4 siRNA. p < 0.05 was considered as significant.
FIGURE 8.
FIGURE 8.
Effect of Tβ4 treatment and transfection with miR-146a, anti-miR-146a, and Tβ4 siRNA on MBP expression and downstream signaling mediators of TLR in the primary rat embryonic OPCs. In the left panel, the primary rat embryonic OPCs were transfected with control pcDNA3 vector (Control vector), miR-146a expression vector (miR-146a vector), control pcDNA3 vector followed by Tβ4 treatment (Tβ4 (100 ng/ml)), and miR-146a expression vector followed by Tβ4 (100 ng/ml) treatment (miR-146a + Tβ4) (shown at the top). In the right panel, the primary rat embryonic OPCs were transfected with control siRNA, anti-miR-146a, Tβ4 siRNA, Tβ4 siRNA + miR-146a, and anti-miR-146a followed by Tβ4 (100 ng/ml) treatment (anti-miR-146a + Tβ4) (shown at the top). These cells were lysed for protein extraction and Western blot analysis. The loading of the samples was normalized with α-tubulin. Migrations of proteins are shown at the right. Molecular mass markers are shown at the left in kDa. Note that miR-146a transfection combined with Tβ4 treatment markedly induced MBP expression in the OPCs. Note that Tβ4 treatment fails to induce MBP expression in the absence of miR-146a and that miR-146a transfection has no effect on MBP expression in Tβ4-negative OPCs. P-, phosphorylated.
FIGURE 9.
FIGURE 9.
Western blot analysis of MBP and downstream signaling mediators of TLR after Tβ4 treatment and transfection with miR-146a, anti-miR-146a, and Tβ4 siRNA in the mouse OPC cell line N20.1. The left panel indicates N20.1 cells transfected with control pcDNA3 vector (Control vector), miR-146a expression vector (miR-146a vector), control pcDNA3 vector followed by Tβ4 treatment (Tβ4 (100 ng/ml)), and miR-146a expression vector followed by Tβ4 (100 ng/ml) treatment (miR-146a + Tβ4) (shown at the top). The right panel indicates N20.1 cells transfected with control siRNA, anti-miR-146a, Tβ4 siRNA, Tβ4 siRNA + miR-146a, and anti-miR-146a followed by Tβ4 (100 ng/ml) treatment (anti-miR-146a + Tβ4) (shown at the top). The loading of the samples was normalized with α-tubulin. Migrations of proteins are shown at the right. Molecular mass markers are shown at the left in kDa. Note that marked induction of MBP was observed after miR-146a transfection combined with Tβ4 treatment in N20.1. Note that neither Tβ4 treatment nor miR-146a transfection had any effect on MBP expression in the absence of miR-146a or Tβ4 in N20.1 cells. P-, phosphorylated.
FIGURE 10.
FIGURE 10.
Quantitative analysis of expression of MBP, IRAK1, TRAF6, p38 MAPK, phosphorylated p38 MAPK (P-p38), and Krox-20/EGR2 at the protein level. Western blot data from the primary rat embryonic OPCs and mouse OPC cell line N20.1 transfected with control vector and miR-146a expression vector followed by treatment with/without Tβ4 (100 ng/ml) were quantified based on histogram analysis in comparison with α-tubulin. The bar graph indicates relative protein expression in comparison with α-tubulin (at left) for MBP, IRAK1, TRAF6, p38 MAPK, phospho-p38 MAPK, and Krox-20 (EGR2) (at the bottom) in primary rat embryonic OPCs and mouse N20.1 cells.
FIGURE 11.
FIGURE 11.
Effect of pharmaceutical specific inhibitors of p38 MAPK and JNK1 and siRNAs of IRAK1 and TRAF6 on protein expression of IRAK1, TRAF6, MBP, p38 MAPK, phosphorylated p38 MAPK (P-p38MAPK), and Krox-20/EGR2 by Western blot analysis in primary rat embryonic OPCs and mouse N20.1 cells. The primary rat embryonic OPCs (two left panels) and mouse N20.1 cells (two right panels) are shown for the treatment with DMSO in the same concentration of inhibitors as control, pharmaceutical specific inhibitors of p38 MAPK and JNK and transfection with control siRNA, IRAK siRNA, and TRAF6 siRNA. The loading of the samples was normalized with α-tubulin. Migrations of proteins are shown at the right. Molecular mass markers are shown at the left in kDa. P-, phosphorylated.
FIGURE 12.
FIGURE 12.
Tβ4-mediated MBP expression depends on the expression of transcription factor Krox-2/EGR2 in primary rat embryonic OPCs and mouse N20.1 cells. A, Western blot analysis of primary rat embryonic OPCs (top) and mouse N20.1 cells (bottom) were subjected to control siRNA transfection as control, Tβ4 (100 ng/ml) treatment, Tβ4 (100 ng/ml) treatment combined with either p38 MAPK inhibitor or JNK1 inhibitor, or Krox-20/EGR2 siRNA transfection. Migrations of proteins are shown at the right. Molecular mass markers are shown at the left in kDa. B, bar graph indicates quantitative analysis of protein expression of Krox-20 (EGR2) and MBP from Western blot data from A based on histogram analysis in comparison with α-tubulin. C, bar graph indicates quantitative analysis of mRNA expression of Krox-20 (EGR2) and MBP from total RNA samples of the same cells used for Western blot analysis in A by qrtPCR.
FIGURE 13.
FIGURE 13.
Immunohistochemistry of MBP in primary rat embryonic OPCs mouse N20.1 cells. The primary rat embryonic OPCs (left) and N20.1 cells (right) were transfected with control vector (control), and cells were treated with Tβ4 (100 ng/ml) (Tβ4 (100 ng/ml)). Similarly, OPCs were also transfected with miR-146a, and miR-146a-transfected cells were treated with Tβ4 (100 ng/ml) (Tβ4 + 146a). The cells were immunofluorescence-stained with Cy3-labeled antibody against OL marker MBP and counterstained with DAPI. Images are merged (Merged).
FIGURE 14.
FIGURE 14.
Quantitative analysis of MBP-positive cells in primary rat embryonic OPCs and mouse N20.1 cells. Primary rat embryonic OPCs and mouse N20.1 cells were transfected with control vector and miR-146a vector (miR-146a transfection) followed by treatment without and with Tβ4 (Tβ4 (100 ng/ml) and miR-146a transfection + Tβ4 (100 ng/ml)). MBP-positive cells after immunofluorescence staining were quantified by cell counting. The bar graph indicates the percentage of MBP-positive cells in primary rat embryonic OPCs and mouse N20.1 cells when DAPI-positive cells were considered as 100% (i.e. total number of cells). p < 0.05 was considered as significant.

Similar articles

Cited by

References

    1. Goldstein A. L., Slater F. D., White A. (1966) Preparation, assay, and partial purification of a thymic lymphocytopoietic factor (thymosin). Proc. Natl. Acad. Sci. U.S.A. 56, 1010–1017 - PMC - PubMed
    1. Huff T., Müller C. S., Otto A. M., Netzker R., Hannappel E. (2001) β-Thymosins, small acidic peptides with multiple functions. Int. J. Biochem. Cell Biol. 33, 205–220 - PubMed
    1. Sanders M. C., Goldstein A. L., Wang Y. L. (1992) Thymosin β4 (Fx peptide) is a potent regulator of actin polymerization in living cells. Proc. Natl. Acad. Sci. U.S.A. 89, 4678–4682 - PMC - PubMed
    1. Goldstein A. L., Hannappel E., Kleinman H. K. (2005) Thymosin β4: actin-sequestering protein moonlights to repair injured tissues. Trends Mol. Med. 11, 421–429 - PubMed
    1. Morris D. C., Chopp M., Zhang L., Lu M., Zhang Z. G. (2010) Thymosin β4 improves functional neurological outcome in a rat model of embolic stroke. Neuroscience 169, 674–682 - PMC - PubMed

Publication types

MeSH terms

LinkOut - more resources