

Early-onset formation of parenchymal plaque amyloid abrogates cerebral microvascular amyloid accumulation in transgenic mice
- PMID: 24828504
- PMCID: PMC4067220
- DOI: 10.1074/jbc.M113.536565
Early-onset formation of parenchymal plaque amyloid abrogates cerebral microvascular amyloid accumulation in transgenic mice
Abstract
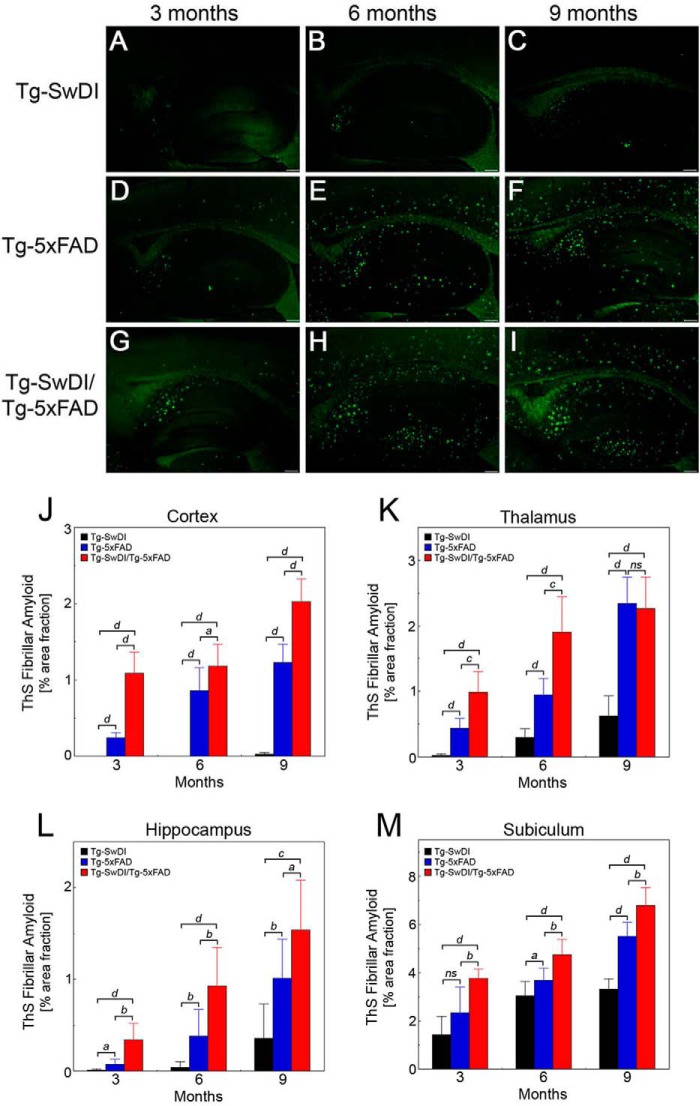
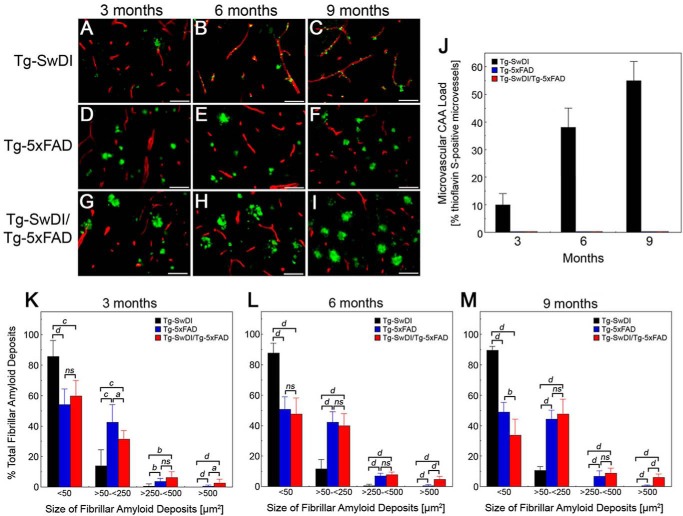
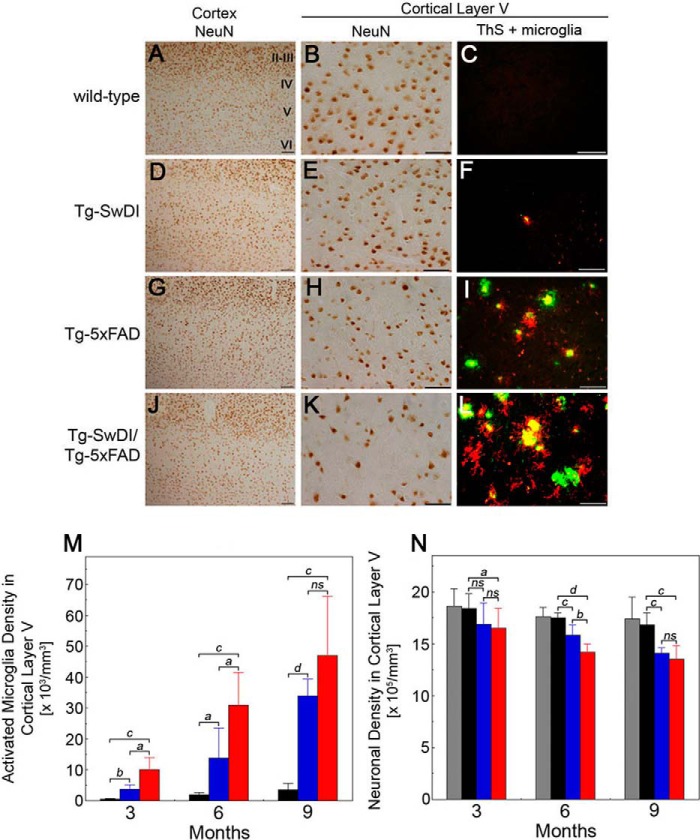
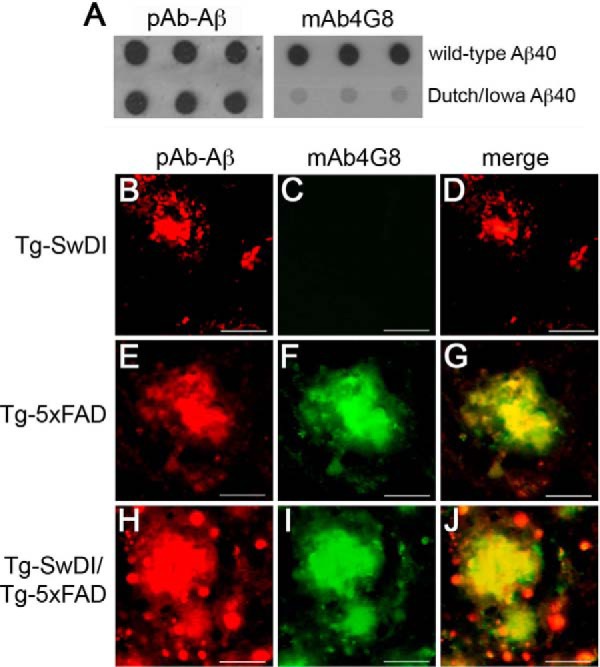
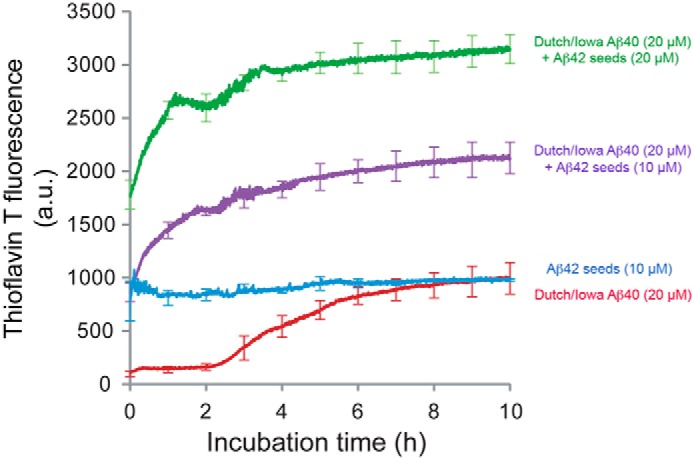
The fibrillar assembly and deposition of amyloid β (Aβ) protein, a key pathology of Alzheimer disease, can occur in the form of parenchymal amyloid plaques and cerebral amyloid angiopathy (CAA). Familial forms of CAA exist in the absence of appreciable parenchymal amyloid pathology. The molecular interplay between parenchymal amyloid plaques and CAA is unclear. Here we investigated how early-onset parenchymal amyloid plaques impact the development of microvascular amyloid in transgenic mice. Tg-5xFAD mice, which produce non-mutated human Aβ and develop early-onset parenchymal amyloid plaques, were bred to Tg-SwDI mice, which produce familial CAA mutant human Aβ and develop cerebral microvascular amyloid. The bigenic mice presented with an elevated accumulation of Aβ and fibrillar amyloid in the brain compared with either single transgenic line. Tg-SwDI/Tg-5xFAD mice were devoid of microvascular amyloid, the prominent pathology of Tg-SwDI mice, but exhibited larger parenchymal amyloid plaques compared with Tg-5xFAD mice. The larger parenchymal amyloid deposits were associated with a higher loss of cortical neurons and elevated activated microglia in the bigenic Tg-SwDI/Tg-5xFAD mice. The periphery of parenchymal amyloid plaques was largely composed of CAA mutant Aβ. Non-mutated Aβ fibril seeds promoted CAA mutant Aβ fibril formation in vitro. Further, intrahippocampal administration of biotin-labeled CAA mutant Aβ peptide accumulated on and adjacent to pre-existing parenchymal amyloid plaques in Tg-5xFAD mice. These findings indicate that early-onset parenchymal amyloid plaques can serve as a scaffold to capture CAA mutant Aβ peptides and prevent their accumulation in cerebral microvessels.
Keywords: Alzheimer Disease; Amyloid; Cerebral Vascular; Pathology; Plaque; Protein Misfolding; Transgenic Mice.
© 2014 by The American Society for Biochemistry and Molecular Biology, Inc.
Figures


Similar articles
-
Human apolipoprotein E2 promotes parenchymal amyloid deposition and neuronal loss in vasculotropic mutant amyloid-β protein Tg-SwDI mice.J Alzheimers Dis. 2012;31(2):359-69. doi: 10.3233/JAD-2012-120421. J Alzheimers Dis. 2012. PMID: 22635103
-
Human apolipoprotein E redistributes fibrillar amyloid deposition in Tg-SwDI mice.J Neurosci. 2008 May 14;28(20):5312-20. doi: 10.1523/JNEUROSCI.1042-08.2008. J Neurosci. 2008. PMID: 18480287 Free PMC article.
-
Murine versus human apolipoprotein E4: differential facilitation of and co-localization in cerebral amyloid angiopathy and amyloid plaques in APP transgenic mouse models.Acta Neuropathol Commun. 2015 Nov 10;3:70. doi: 10.1186/s40478-015-0250-y. Acta Neuropathol Commun. 2015. PMID: 26556230 Free PMC article.
-
Tg-SwDI transgenic mice: A suitable model for Alzheimer's disease and cerebral amyloid angiopathy basic research and preclinical studies.Exp Neurol. 2025 May;387:115189. doi: 10.1016/j.expneurol.2025.115189. Epub 2025 Feb 18. Exp Neurol. 2025. PMID: 39978567 Review.
-
Hereditary and sporadic forms of abeta-cerebrovascular amyloidosis and relevant transgenic mouse models.Int J Mol Sci. 2009 Apr 23;10(4):1872-1895. doi: 10.3390/ijms10041872. Int J Mol Sci. 2009. PMID: 19468344 Free PMC article. Review.
Cited by
-
Behavioral and electrophysiological evidence for a neuroprotective role of aquaporin-4 in the 5xFAD transgenic mice model.Acta Neuropathol Commun. 2020 May 12;8(1):67. doi: 10.1186/s40478-020-00936-3. Acta Neuropathol Commun. 2020. PMID: 32398151 Free PMC article.
-
A Function of Amyloid-β in Mediating Activity-Dependent Axon/Synapse Competition May Unify Its Roles in Brain Physiology and Pathology.J Alzheimers Dis. 2023;92(1):29-57. doi: 10.3233/JAD-221042. J Alzheimers Dis. 2023. PMID: 36710681 Free PMC article. Review.
-
Role of amyloid peptides in vascular dysfunction and platelet dysregulation in Alzheimer's disease.Front Cell Neurosci. 2015 Mar 3;9:65. doi: 10.3389/fncel.2015.00065. eCollection 2015. Front Cell Neurosci. 2015. PMID: 25784858 Free PMC article. Review.
-
Preservation of dendritic spine morphology and postsynaptic signaling markers after treatment with solid lipid curcumin particles in the 5xFAD mouse model of Alzheimer's amyloidosis.Alzheimers Res Ther. 2021 Feb 8;13(1):37. doi: 10.1186/s13195-021-00769-9. Alzheimers Res Ther. 2021. Retraction in: Alzheimers Res Ther. 2023 Sep 29;15(1):162. doi: 10.1186/s13195-023-01313-7. PMID: 33557949 Free PMC article. Retracted.
-
Solid lipid curcumin particles provide greater anti-amyloid, anti-inflammatory and neuroprotective effects than curcumin in the 5xFAD mouse model of Alzheimer's disease.BMC Neurosci. 2018 Feb 23;19(1):7. doi: 10.1186/s12868-018-0406-3. BMC Neurosci. 2018. Retraction in: BMC Neurosci. 2023 Feb 24;24(1):16. doi: 10.1186/s12868-023-00785-5. PMID: 29471781 Free PMC article. Retracted.
References
Publication types
MeSH terms
Substances
Grants and funding
LinkOut - more resources
Full Text Sources
Other Literature Sources
Miscellaneous
