. 2014 May 14;34(20):6860-73.
doi: 10.1523/JNEUROSCI.5173-13.2014.

Feature interactions enable decoding of sensorimotor transformations for goal-directed movement

Affiliations

Feature interactions enable decoding of sensorimotor transformations for goal-directed movement

Deborah A Barany et al. J Neurosci. .

Abstract

Neurophysiology and neuroimaging evidence shows that the brain represents multiple environmental and body-related features to compute transformations from sensory input to motor output. However, it is unclear how these features interact during goal-directed movement. To investigate this issue, we examined the representations of sensory and motor features of human hand movements within the left-hemisphere motor network. In a rapid event-related fMRI design, we measured cortical activity as participants performed right-handed movements at the wrist, with either of two postures and two amplitudes, to move a cursor to targets at different locations. Using a multivoxel analysis technique with rigorous generalization tests, we reliably distinguished representations of task-related features (primarily target location, movement direction, and posture) in multiple regions. In particular, we identified an interaction between target location and movement direction in the superior parietal lobule, which may underlie a transformation from the location of the target in space to a movement vector. In addition, we found an influence of posture on primary motor, premotor, and parietal regions. Together, these results reveal the complex interactions between different sensory and motor features that drive the computation of sensorimotor transformations.

Keywords: MVPA; fMRI; sensorimotor transformations.


Figures

Figure 1.
Figure 1.
Experimental setup. Participants were positioned with their legs to the left of the scanner table to allow more room for wrist movement. A custom-made motion-tracking device was placed on the back of the participant's right hand. Cameras recorded the rigid-body positions of the tracking device during the task. The participant is shown in the neutral position (corresponding to the middle target) for the palm-down posture.
Figure 2.
Figure 2.
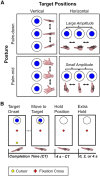
Task design. A, All wrist movements were completed across four different run types. Each run was performed with either a palm-down or palm-mid posture and to vertical or horizontal targets. The targets are depicted next to the wrist position required to reach the target for the given posture (note that the wrist positions shown exaggerate the actual deviation necessary to reach the target). Each movement within a run was either of small (center-out and to-the-center movements) or large amplitude. B, Task progression. CT, Completion time. Participants were instructed to move their wrist to guide a yellow cursor to the inner blue target after target onset. The cursor and blue target disappeared after reaching the target and participants were required to hold their position until the next target appeared. The boxes depict an example of the visual stimuli seen by the participant when performing a large-amplitude movement to the top target. Below each box are the wrist positions in the palm-down posture associated with each cursor position (the actual wrist deviation required for a large-amplitude movement was 15.6°). The length of the hold depended on the CT such that the next target onset or hold trial followed 4 s after the previous target onset. BOLD responses were estimated from both the target onset of the movement and the onset of the 2 s extra hold trials.
Figure 3.
Figure 3.
Anatomical ROIs for a typical participant. The RH CA (data not shown) was used for one test as a control region. Otherwise, all ROIs were in the LH.
Figure 4.
Figure 4.
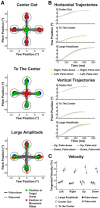
Kinematic performance. A, Example of movement paths from one participant for each of the 24 movement types organized into subplots according to movement category (center-out, to-the-center, or large-amplitude). Each path is depicted as a line connecting a green dot to a red dot, where a green dot indicates the hand position at target onset and the red dot indicates the hand position at movement offset. The gray lines indicate movements made with a palm-mid posture and the black lines indicate movements made with a palm-down posture. The paths are overlaid on the five different target positions to indicate how the wrist positions map onto the cursor positions seen by the participant. B, Average positions of the wrist from the center target as a function of time from movement onset plotted separately for horizontal trajectories (for rightward and leftward movements) and vertical trajectories (for upward and downward movements). Positions for leftward and downward movements were mirror reflected approximately 0° before trial averaging, so that all movements for each movement category could be plotted with the same start point. Each trajectory is plotted up to the mean movement time for the given movement category. The shaded color areas indicate the SE of the trajectories across participants at each time point. C, Average tangential velocity (±SE) across all participants for each of the 24 movement types.
Figure 5.
Figure 5.
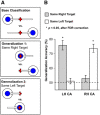
Decoding spatial target location. A, Visualization of base classification and generalization tests. Targets (large white circle and blue inner circle) show the goal position for the given movement (red fixation cross is in the center of the screen). The white arrows depict the directionality and length of the movement. For both base classification and generalization, movements in both palm-down and palm-mid postures were included. Base classification accuracy was computed using a stratified k-fold cross-validation procedure. Generalization accuracy was based on how well the base classifier decoded the two movement types in the generalization test. For example, in Generalization 1, a small-amplitude rightward movement to the right target (bottom movement in the center panel) was counted as correct if the base classifier decoded it as a large-amplitude rightward movement to the right target (bottom movement in the top panel). B, Classification accuracies for the two generalization tests for LH and RH CA. Both regions had significant above-chance accuracies for base classification (see Results). Dashed line represents at-chance performance (50%). Error bars represent within-subject SEM (Morey, 2008). Black asterisks indicate significantly above-chance classification after FDR correction (Benjamini and Yekutieli, 2001).
Figure 6.
Figure 6.
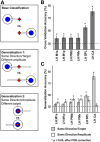
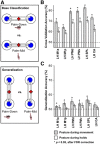
Relative decoding of movement direction and target location. A, Visualization of base classification and generalization tests. Base classification and generalization tests are depicted in the same way as in Figure 5A. In this case, in Generalization 1, a large-amplitude leftward movement (top movement in the center panel) was counted as correct if the base classifier decoded it as a center-out leftward movement (top movement in the top panel). In Generalization 2, a to-the-center leftward movement (top movement in the bottom panel) was correct if it was decoded as a center-out leftward movement. Movements included were pooled across palm-down and palm-mid postures. B, Base classification accuracies for the LH regions. C, Classification accuracies for the two generalization tests. Note that although PMd, PMv, and SPL all show significant above-chance classification in both generalization tests, there is an interaction such that SPL has higher accuracy when movement direction and spatial target location are the same as in base classification. In contrast, PMd and PMv have higher accuracies when movement direction and movement amplitude are the same as in base classification. Dashed line represents at-chance performance (50%). Error bars represent within-subject SEM (Morey, 2008). Black asterisks indicate significantly above-chance classification after FDR correction (Benjamini and Yekutieli, 2001).
Figure 7.
Figure 7.
Decoding posture across movement direction. A, Visualization of base classification and the generalization test. Base classification and generalization are depicted in the same way as in Figure 5A except that movements were not pooled across postures. Note that, here, postures are matched for base classification and generalization. For example, a palm-down up movement (one of the left movements in the bottom panel) is correctly classified if the base classifier decodes it as a palm-down left or right movement (top movements in the top panel). To test for static posture, we did not use the movement trials as shown, but rather used 2 s “hold trials” to peripheral targets that occurred after some movements. B, Base classification accuracies for LH regions. Note that there are two separate base classifications: one for movements and one for holds. C, Classification accuracies for the two generalization tests. Generalization accuracies reflect the average of the base classification/generalization pair shown and the opposite pair (i.e., base classification contains up/down movements and generalization contains left/right movements). Because generalization accuracies for posture during movement and posture during holds used different base classifiers, they cannot be compared directly. Dashed line represents at-chance performance (50%). Error bars represent within-subject SEM (Morey, 2008). Black asterisks indicate significantly above-chance classification after FDR correction (Benjamini and Yekutieli, 2001).
Figure 8.
Figure 8.
Decoding direction and joint across posture. A, Visualization of a representative base classification and generalization pair. Base classification and generalization are depicted in the same way as in Figure 5A except that movements were not pooled across postures. In the example shown, in Generalization 1, a large-amplitude leftward movement in the palm-down posture (top movement in the center panel) was correctly classified if it was decoded as a large-amplitude leftward movement in the palm-mid posture (top movement in the top panel). In Generalization 2, a large-amplitude downward movement in the palm-down posture (i.e., a flexion, left movement in the bottom panel) was correct if it was decoded as a large-amplitude leftward movement in the palm-mid posture (i.e., a flexion). B, Base classification accuracies for LH regions. Overall accuracies reflect the individual accuracies for the four possible base classifications (see Results for details). C, Classification accuracies for the two generalization tests. Accuracies shown reflect the average of four base classification/generalization pairs. Note that M1a, M1p, PMd, and PMv do not have significant generalization accuracies when movement direction is matched in the base classification/generalization pairs. This is in contrast to the significant generalization accuracies for movement direction shown in Figure 6C, when classification was based on pooled postures. Dashed line represents at-chance performance (50%). Error bars represent within-subject SEM (Morey, 2008). Black asterisks indicate significantly above-chance classification, after FDR correction (Benjamini and Yekutieli, 2001).

Similar articles

Cited by

References

    1. Ajemian R, Bullock D, Grossberg S. A model of movement coordinates in the motor cortex: posture-dependent changes in the gain and direction of single cell tuning curves. Cereb Cortex. 2001;11:1124–1135. doi: 10.1093/cercor/11.12.1124. - DOI - PubMed
    1. Benjamini Y, Yekutieli D. The control of the false discovery rate in multiple testing under dependency. The Annals of Statistics. 2001;29:919–1188.
    1. Beurze SM, Toni I, Pisella L, Medendorp WP. Reference frames for reach planning in human parietofrontal cortex. J Neurophysiol. 2010;104:1736–1745. doi: 10.1152/jn.01044.2009. - DOI - PubMed
    1. Blangero A, Menz MM, McNamara A, Binkofski F. Parietal modules for reaching. Neuropsychologia. 2009;47:1500–1507. doi: 10.1016/j.neuropsychologia.2008.11.030. - DOI - PubMed
    1. Bode S, Haynes JD. Decoding sequential stages of task preparation in the human brain. Neuroimage. 2009;45:606–613. doi: 10.1016/j.neuroimage.2008.11.031. - DOI - PubMed

Publication types