. 2014 May 14;34(20):6970-84.
doi: 10.1523/JNEUROSCI.3366-13.2014.

Hyperlipidemic diet causes loss of olfactory sensory neurons, reduces olfactory discrimination, and disrupts odor-reversal learning

Affiliations

Hyperlipidemic diet causes loss of olfactory sensory neurons, reduces olfactory discrimination, and disrupts odor-reversal learning

Nicolas Thiebaud et al. J Neurosci. .

Abstract

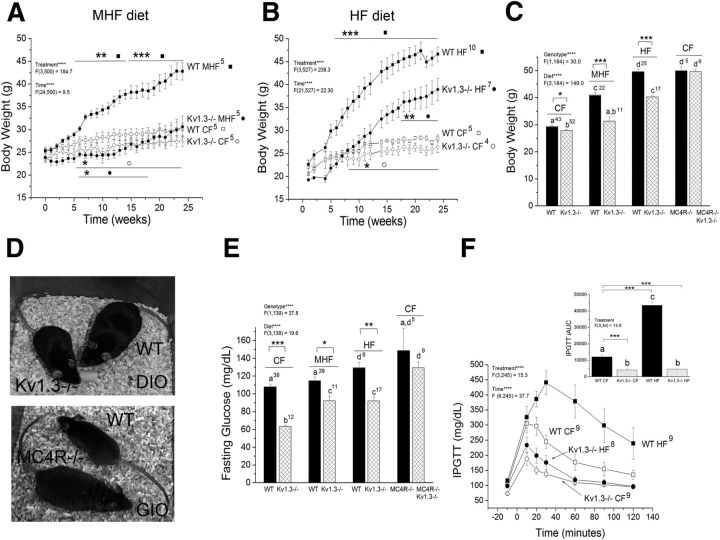
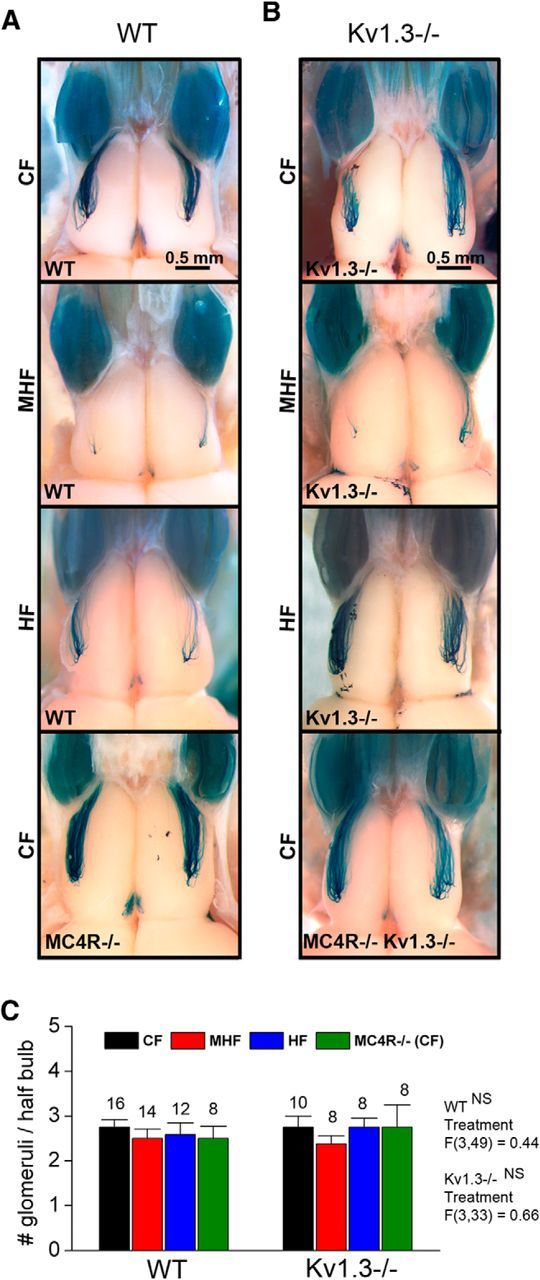
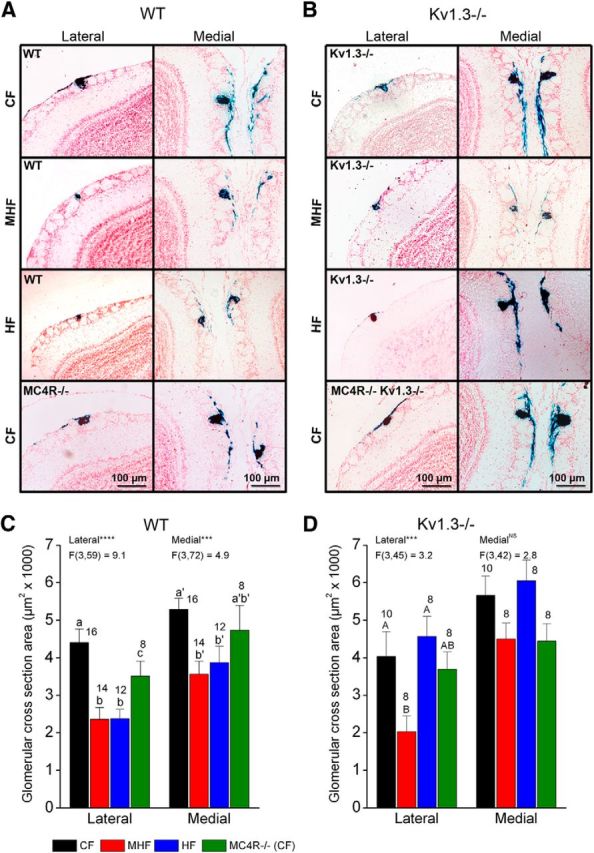
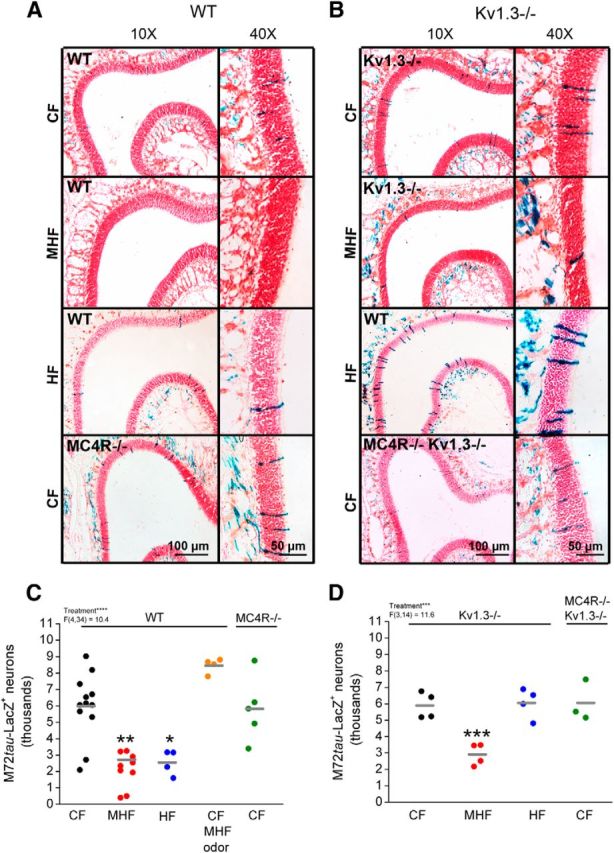
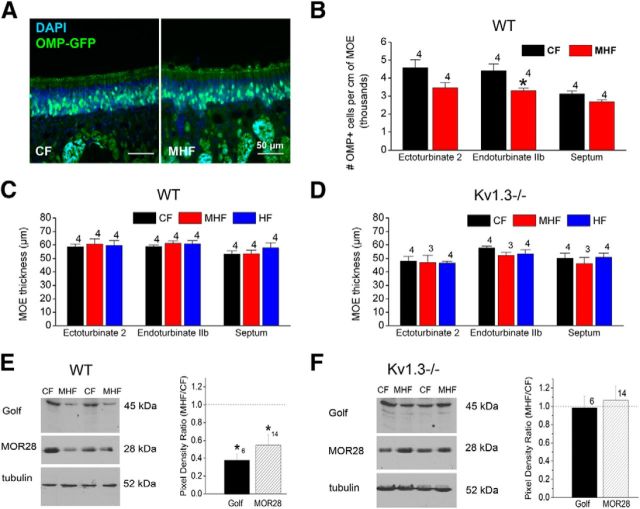
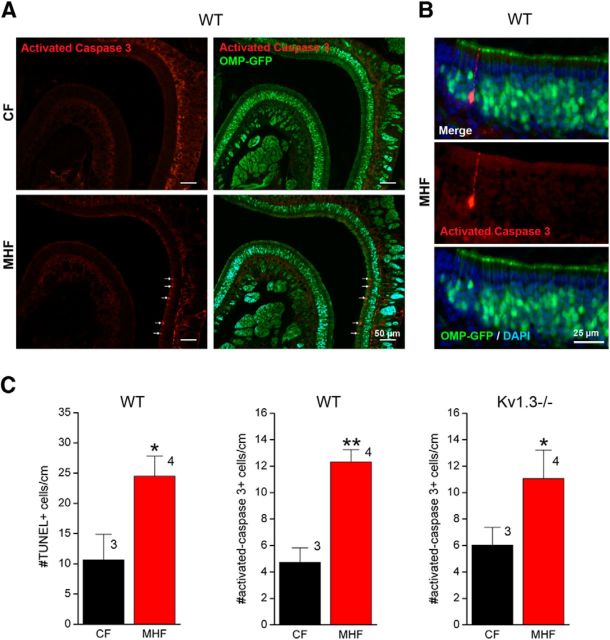
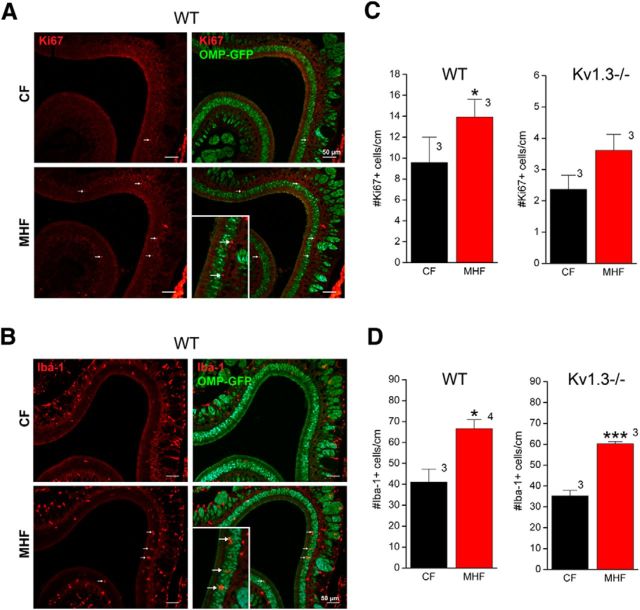
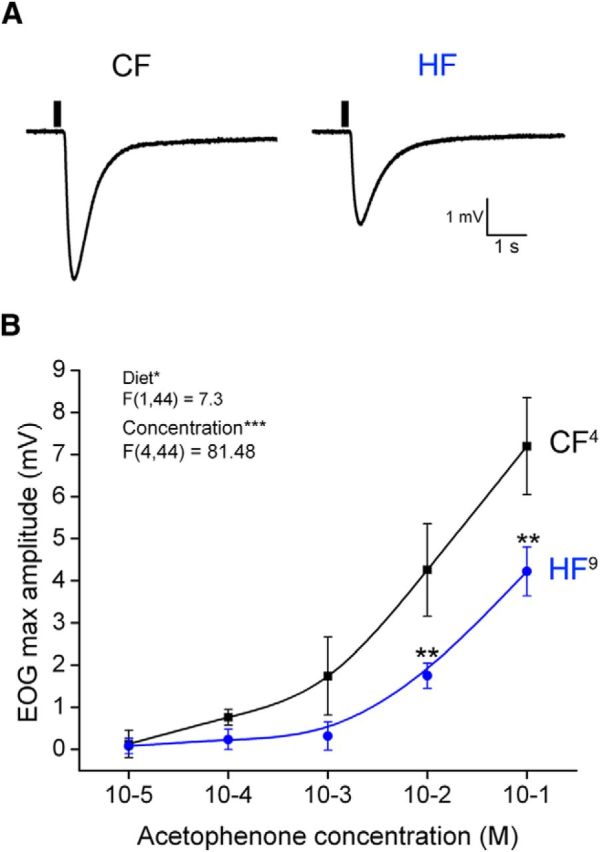
Currently, 65% of Americans are overweight, which leads to well-supported cardiovascular and cognitive declines. Little, however, is known concerning obesity's impact on sensory systems. Because olfaction is linked with ingestive behavior to guide food choice, its potential dysfunction during obesity could evoke a positive feedback loop to perpetuate poor ingestive behaviors. To determine the effect of chronic energy imbalance and reveal any structural or functional changes associated with obesity, we induced long-term, diet-induced obesity by challenging mice to high-fat diets: (1) in an obesity-prone (C57BL/6J) and obesity-resistant (Kv1.3(-/-)) line of mice, and compared this with (2) late-onset, genetic-induced obesity in MC4R(-/-) mice in which diabetes secondarily precipitates after disruption of the hypothalamic axis. We report marked loss of olfactory sensory neurons and their axonal projections after exposure to a fatty diet, with a concomitant reduction in electro-olfactogram amplitude. Loss of olfactory neurons and associated circuitry is linked to changes in neuronal proliferation and normal apoptotic cycles. Using a computer-controlled, liquid-based olfactometer, mice maintained on fatty diets learn reward-reinforced behaviors more slowly, have deficits in reversal learning demonstrating behavioral inflexibility, and exhibit reduced olfactory discrimination. When obese mice are removed from their high-fat diet to regain normal body weight and fasting glucose, olfactory dysfunctions are retained. We conclude that chronic energy imbalance therefore presents long-lasting structural and functional changes in the operation of the sensory system designed to encode external and internal chemical information and leads to altered olfactory- and reward-driven behaviors.

Keywords: chemical senses; circuitry; metabolism; obesity; olfactory; sensory.


Figures

Figure 1.
Figure 1.
Resistance to increased body weight, elevated fasting glucose, and associated glucose clearance for male mice on Kv1.3-null backgrounds (Kv1.3−/−) challenged on various diets and expressing the M72-IRES-tau-LacZ transgene (see Materials and Methods). A, B, Line graph of the mean ± SEM body weight for mice weaned to CF (13.5% fat), MHF (32% fat), or HF (60% fat) diets. C, Bar graph of the mean body weight taken at the 6 month time point. Data are grouped to compare genotype within similar diet (CF, MHF, or HF) and are also compared with MC4R−/− and MC4R−/−Kv1.3−/− mice on CF chow similarly measured 6 months after weaning. Black bars represent WT. Hatched bars represent Kv1.3−/− or Kv1.3−/− background. D, (Top) Photograph of a representative WT and Kv1.3−/− mouse 24 weeks after weaning to MHF diet that promotes DIO. Bottom, Photograph of a representative WT and MC4R−/− mouse 24 weeks after weaning to a CF diet in which late-onset, genetic-induced obesity (GIO) is developed because of disruption of the hypothalamic axis. E, Bar graph of the fasting glucose taken by tail bleed for a subsample of the mice in C. F, Line graph of the mean ± SEM plasma glucose concentration over time in the IPGTT. Inset, Bar graph of the mean ± SEM integration of the area under the curve (iAUC). A–C, E, F, Number of mice per treatment group as indicated. Analyzed factors, degrees of freedom, number of measurements, F value, and level of significance (****p ≤ 0.0001, ***p ≤0.001, **p ≤ 0.01, *p ≤ 0.05). NS, Not significant (p > 0.05) as indicated in the panels. Two-way ANOVA was a blocked factorial design (A, B, F) or completely randomized (C, E). One-way ANOVA (F, inset). Post hoc tests were performed (in this and subsequent analyses) with a Bonferroni correction for mean-wise comparisons and were indicated with lettering; means noted with the same letter are not significantly different. Highlighted comparisons to the WT mean are also indicated with a bar and varying p values in the post hoc analyses.
Figure 2.
Figure 2.
Axonal projections to the M72 glomerulus are reduced following an MHF diet in both WT and Kv1.3−/− mice, whereas the response to the HF diet is differential across genotypes. The number of glomerular targets is not modified with diet regardless of genotype. A, Whole-mount images of the OBs from WT littermates maintained on a CF, MHF, or HF diet for 6 months. B, Same as in A, but for Kv1.3−/− littermates. A, B, Bottom panels, Representative genetically obese mice on the WT (MC4R−/−) or Kv1.3−/− background (MC4R−/−/Kv1.3−/−), respectively. C, Mean ± SEM number of M72 glomeruli/half OB following fat feeding or induction of the MC4R−/− phenotype for the same 6 month duration. Not significantly different (NS) by one-way ANOVA performed within genotype (p ≥ 0.05). Noted sample sizes represent number of half OBs/treatment.
Figure 3.
Figure 3.
The size of axonal projections to the M72 glomerulus is reduced after an MHF or HF diet. A, B, Same experimental paradigm as in Figure 2, but showing the (left) lateral versus (right) medial M72 glomerulus. C, D, Glomerular cross-sectional area for mice in (A,B) quantifying (C) WT versus (D) Kv1.3−/− backgrounds. One-way ANOVA performed within genotype for each type of glomerulus. ***p ≤0.001. ****p ≤ 0.0001. NS, Not significant (p > 0.05). Noted sample sizes represent number of half OBs/treatment. Error bars are mean ± SEM.
Figure 4.
Figure 4.
MHF and HF diet cause a loss of OSNs. A, B, Same conditions as Figure 2A, B but for the MOE as viewed at low (left, 10×) or high (right, 40×) magnification. C, D, Number of M72-expressing OSNs/epithelium (per mouse) following CF (black), MHF (red), HF (blue), or CF with MHF chow in a tea ball (yellow; CF MHF odor) for 6 months. MC4R−/− or MC4R−/−/Kv1.3−/− (green). Sample mean (line). One-way ANOVA performed within genotype. *p ≤ 0.05. **p ≤ 0.01. ***p ≤ 0.001.
Figure 5.
Figure 5.
Fatty diet causes loss of mature OSNs in endoturbinate II without modification of MOE thickness and reduces expression of signal transduction proteins. A, Coronal sections of the MOE of OMP-GFP littermates maintained for 6 months on specified diets. DAPI is the nuclear stain. B, Mean ± SEM number of OMP-positive neurons/cm. Sample size represents number of mice, Student's t test analyzed within region across diet. *p ≤ 0.05. C, D, Same as in B but for thickness of the MOE in microns for (C) WT versus (D) Kv1.3−/−. One-way ANOVA analyzed within region across diet. Not significantly different means. E, F, SDS-PAGE Western blot analysis of purified MOE membranes from (E) WT or (F) Kv1.3−/− mice on specified diets for 6 months. Two representative mouse pairs are shown labeled with antisera for the GTP binding protein, Golf, or the odorant receptor, MOR28. Quantitative densitometry normalized to αβ-tubulin III (tubulin). Student's t test, arcsin transformed, sample size represents number of mice. Line indicates ratio of 1.0 (equal expression for MHF and CF). *p ≤ 0.05.
Figure 6.
Figure 6.
Maintenance on a MHF diet simultaneously induces OSN apoptosis and basal cell proliferation in the MOE. A, Representative photomicrographs of the MOEs of OMP-GFP littermates (OMP-GFP; olfactory marker protein; green) that were maintained on CF versus MHF diet for 6 months and then (left) labeled with antiactivated caspase-3 (Activated Caspase 3; red). Right, Dual channel. Arrows indicate activated caspase 3-positive cells. B, Higher magnification of A. C, Mean ± SEM number of (left) TUNEL-positive cells, or (middle, right) activated caspase-3-positive cells in WT and Kv1.3−/− mice, respectively. Student's t test where sample size represents number of mice/treatment using 10 sections/mouse. *p ≤ 0.05. **p ≤ 0.01.
Figure 7.
Figure 7.
Maintenance on a MHF diet simultaneously induces basal cell proliferation in the MOE while activating microglia. A, Representative photomicrographs of the MOEs of OMP-GFP littermates (OMP-GFP; olfactory marker protein; green) that were maintained on CF versus MHF diet for 6 months and then (left) labeled with the proliferation marker, anti-Ki67 (red). Right, Dual channel. Arrows indicate Ki67-positive cells. Inset, Higher magnification indicates positive basal cell labeling. B, Same experimental paradigm as A but labeled with the microglial/macrophage marker, ionizing calcium binding adaptor protein 1, Iba-1 (red). Inset, Higher magnification indicates Iba-1-positive cells. C, Bar graph of the mean ± SEM number of Ki67-positive cells after maintenance for 6 months on CF (black bar) or MHF (red bar) diet. Student's t test where sample size represents number of mice/treatment using 10 sections/mouse. *p ≤ 0.05. ***p ≤ 0.001. D, Bar graph, sample size, and statistical analysis as in C but for Iba-1-positive microglial cells.
Figure 8.
Figure 8.
Maintenance on a HF diet causes a reduction in EOG amplitude in response to the M72 ligand, acetophenone. A, Representative EOG recordings taken from the dorsal surface of endoturbinate IIb and III acquired from a mouse weaned to (left) CF versus (right) HF chow. A total of 10−2 m of acetophenone was applied at the bar for 100 ms. B, Line graph of the mean ± SEM EOG amplitude for CF versus HF maintained mice recorded as in A in response to varying concentrations of odorant. Two-way ANOVA, mixed blocked factorial design, where sample size represents number of recordings (one per mouse). *p ≤ 0.05. **p ≤ 0.01. ***p ≤ 0.001.
Figure 9.
Figure 9.
Mice can be trained in a liquid-based, computerized olfactometer to determine olfactory discrimination using a “go no-go” operant conditioning paradigm. A, Photograph of a mouse in the operant chamber where it is trained to recognize an odorant paired with a water reward in conjunction with a computerized, 8 channel liquid dilution olfactometer (Knosys; for details, see Materials and Methods). B, Insertion of the mouse's snout into the odor-sampling port initiated training for correct licking behavior toward a positive odor cue (S+) and correct rejection behavior toward a negative odor cue (S). C, Example line graph of a typical daily training session in which 20 random trials (defined as a block) are delivered in the form of an equal number of S+ and S odor cues to the mouse for correct decisions that are paired with a water reward. A HIT is defined as correct licking behavior in response to S+, and a CR (correct rejection) is defined as a correct withdrawal of the snout in response to S. A MISS is defined as a withdrawal of the snout in the presence of S+, and a FA (false alarm) is defined as an incorrect licking behavior in response to S. D, Line graph of the representative performance of a WT mouse maintained on control food (CF) diet whereby each data point represents the percentage of correct hits per block (20 trials) as tabulated in Materials and Methods. Generated from data in C upon the first initiation of the mouse to operant conditioning. AA, Amyl acetate. E, Line graph of the representative performance of a WT mouse previously trained in operant conditioning whereby the odorant delivery tubes were disconnected (Valves Only, No Tubing) to control for any mechanical cues that the mouse may be using for task performance. EA, Ethyl acetate. Data points calculated as described in C, D. D, E, Dashed line indicates 50% correct hits (performance by chance alone); solid line indicates 80% correct hits (performance at defined criteria).
Figure 10.
Figure 10.
Fatty diets slow acquisition of operant conditioning behaviors independent of genotype and decrease olfactory discrimination. A, Bar graph of the mean ± SEM number of trials of odor reinforcement learning necessary for successful performance in an operant conditioning paradigm. Dashed line indicates mean number of trials for WT CF mice. Two-way ANOVA where sample size represents number of mice. Inset, Bar graph of the percentage of mice able to learn operant conditioning. Analysis performed using a 2 × 3 contingency, χ2 = 0.22, not significantly different (NS). Error bars are mean ± SEM. Correct hits in an odor versus diluent (water) paradigm comparing (B) the effect of genotype while on CF diet, (C, D) the effect of MHF diet in (C) WT and (D) Kv1.3−/− mice, and (E, F) the effect HF diet in (E) WT and (F) Kv1.3−/− mice. Lines indicate performance resulting from chance alone (dashed line indicates 50 percentile) and performance at defined criteria (solid line indicates 80 percentile). Black represents CF; red represents MHF; blue represents HF. B–F, Two-way ANOVA, blocked factorial design using number of mice as noted. *p ≤ 0.05. ****p ≤ 0.0001.
Figure 11.
Figure 11.
Fatty diet causes behavioral inflexibility as exemplified in failed odor reversal-learning paradigms for WT but not Kv1.3−/− mice. Correct hits in an odor versus odor, reversal learning paradigm (where S+ and S are switched) comparing (A) the effect of genotype while on CF diet, (B, C) the effect of MHF diet in (B) WT and (C) Kv1.3−/− mice, and (D, E) the effect of HF diet in (D) WT and (E) Kv1.3−/− mice. EA, Ethyl acetate; AP, acetophenone. Symbols, color coding and notations as in Figure 10. Red dashed line indicates mean correct hits before reversal learning, S+/S reverse at the bar break or arrow. D, Six WT mice were tested on HF diet, but only 1 animal had the ability to reversal learn (the one demonstrated in the plot). The same goes for B, where only 2 of 5 WT mice tested on MHF diet were able to reversal learn. F, Number of trials required to reachieve criteria after the induction of reversal learning. Inset, Bar graph of the percentage of mice able to reversal learn. Analysis performed using a 2 × 3 contingency, applying a χ2 as reported on graph. A–F, *p ≤ 0.05. ***p ≤ 0.001. ****p ≤ 0.0001. Not tested (NT). A–E, Blocked factorial ANOVA. F, One-way ANOVA. G–J, Plots of the correct hits using a challenge with sequential reversal learning paradigms for (G) WT and (H) Kv1.3−/− mice maintained on CF compared with (I) WT and (J) Kv1.3−/− mice maintained on HF for 6 months. Because mice learn at slightly different rates, plots are individual performances representative of 6 mice/condition. Kv1.3−/− mice are slower in acquisition of the initial (at first arrow of a series) reversal learning challenge, but their speed markedly improves upon subsequent reversal learning trials (subsequent arrows) compared with WT mice. Error bars are mean ± SEM.
Figure 12.
Figure 12.
A fatty diet after weaning prevents odor-reversal learning and the recovery of odor discrimination despite return to CF diet, average fasting glucose level, and normal body weight. A, Plot of the correct hits for a representative WT mouse that was originally weaned to CF and then retained on CF (Reared to CF, Switched to CF) for a 5 month period before rescreening (double hatch). B, A similar plot for a mouse that was weaned to HF and then “dieted” for a 5 month period on CF (Reared to HF, Switched to CF) before rescreening (double hatch). Symbols and notations as in Figure 11. C, Whole-mount images revealing M72 axonal projections to the OB from the mice “dieted” and trained as in A and B, respectively.

Comment in

Similar articles

Cited by

References

    1. Aimé P, Duchamp-Viret P, Chaput MA, Savigner A, Mahfouz M, Julliard AK. Fasting increases and satiation decreases olfactory detection for a neutral odor in rats. Behav Brain Res. 2007;179:258–264. doi: 10.1016/j.bbr.2007.02.012. - DOI - PubMed
    1. Andrikopoulos S, Blair AR, Deluca N, Fam BC, Proietto J. Evaluating the glucose tolerance test in mice. Am J Physiol Endocrinol Metab. 2008;295:E1323–E1332. doi: 10.1152/ajpendo.90617.2008. - DOI - PubMed
    1. Balthasar N. Genetic dissection of neuronal pathways controlling energy homeostasis. Obesity. 2006;14:222S–227S. doi: 10.1038/oby.2006.313. - DOI - PubMed
    1. Balthasar N, Dalgaard LT, Lee CE, Yu J, Funahashi H, Williams T, Ferreira M, Tang V, McGovern RA, Kenny CD, Christiansen LM, Edelstein E, Choi B, Boss O, Aschkenasi C, Zhang CY, Mountjoy K, Kishi T, Elmquist JK, Lowell BB. Divergence of melanocortin pathways in the control of food intake and energy expenditure. Cell. 2005;123:493–505. doi: 10.1016/j.cell.2005.08.035. - DOI - PubMed
    1. Barnea G, O'Donnell S, Mancia F, Sun X, Nemes A, Mendelsohn M, Axel R. Odorant receptors on axon termini in the brain. Science. 2004;304:1468. doi: 10.1126/science.1096146. - DOI - PubMed

Publication types

LinkOut - more resources