. 2014 May 14;34(20):6993-7006.
doi: 10.1523/JNEUROSCI.3911-13.2014.

Memory accumulation mechanisms in human cortex are independent of motor intentions

Affiliations

Memory accumulation mechanisms in human cortex are independent of motor intentions

Carlo Sestieri et al. J Neurosci. .

Abstract

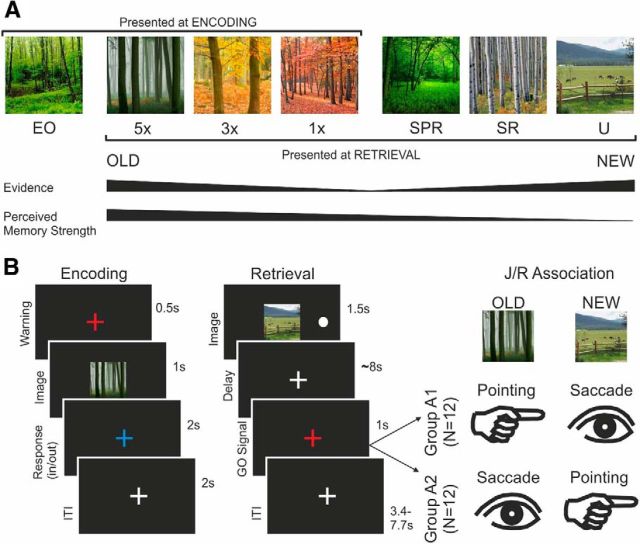
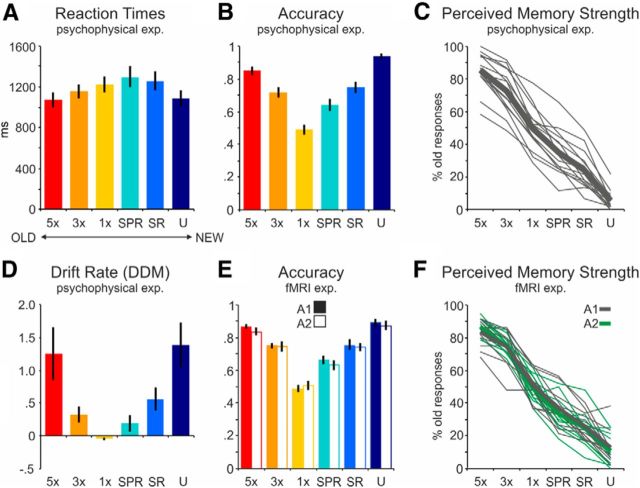
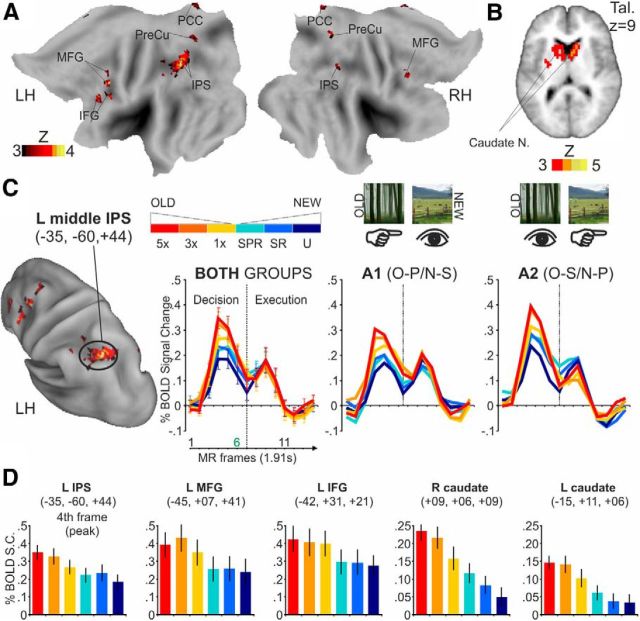
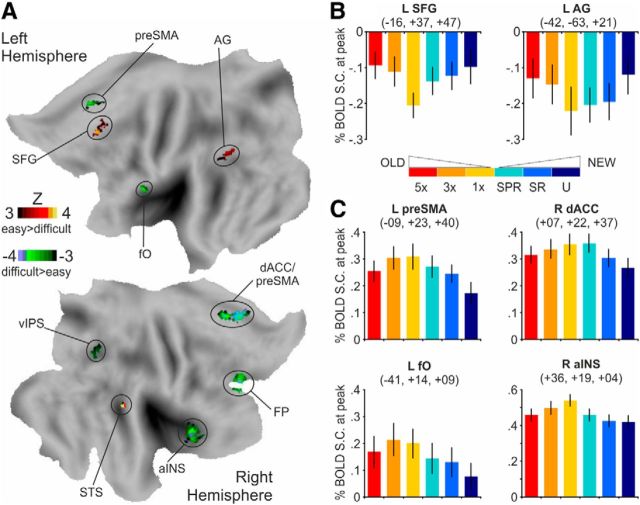
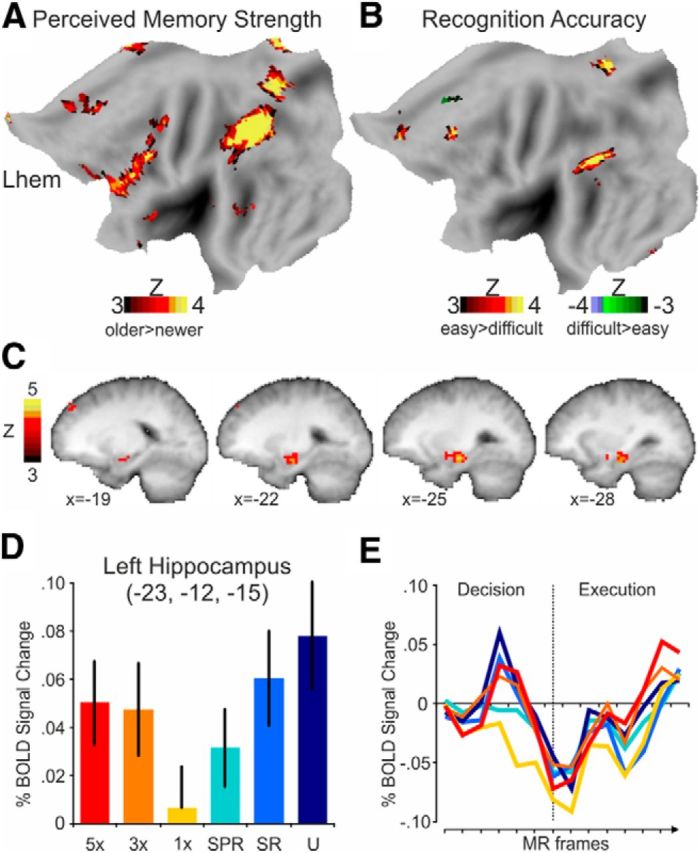
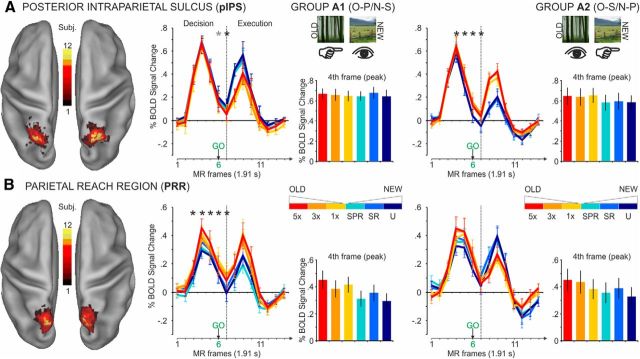
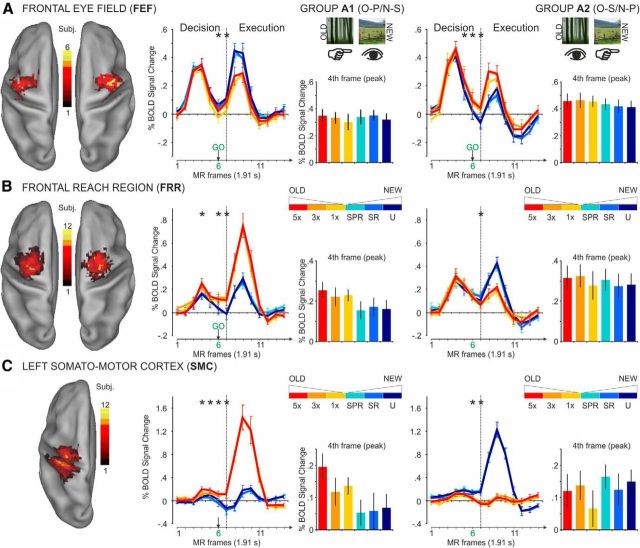
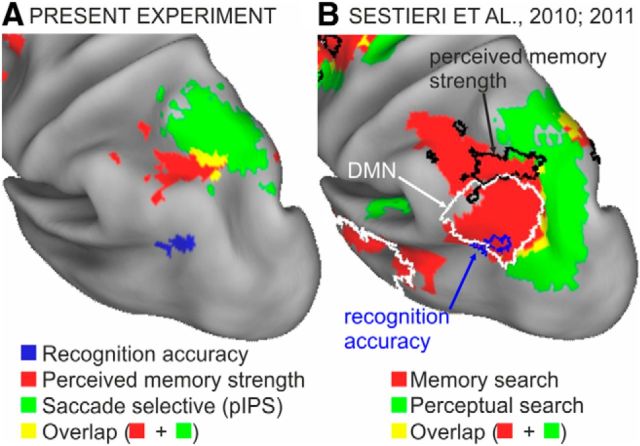
Previous studies on perceptual decision-making have often emphasized a tight link between decisions and motor intentions. Human decisions, however, also depend on memories or experiences that are not closely tied to specific motor responses. Recent neuroimaging findings have suggested that, during episodic retrieval, parietal activity reflects the accumulation of evidence for memory decisions. It is currently unknown, however, whether these evidence accumulation signals are functionally linked to signals for motor intentions coded in frontoparietal regions and whether activity in the putative memory accumulator tracks the amount of evidence for only previous experience, as reflected in "old" reports, or for both old and new decisions, as reflected in the accuracy of memory judgments. Here, human participants used saccadic-eye and hand-pointing movements to report recognition judgments on pictures defined by different degrees of evidence for old or new decisions. A set of cortical regions, including the middle intraparietal sulcus, showed a monotonic variation of the fMRI BOLD signal that scaled with perceived memory strength (older > newer), compatible with an asymmetrical memory accumulator. Another set, including the hippocampus and the angular gyrus, showed a nonmonotonic response profile tracking memory accuracy (higher > lower evidence), compatible with a symmetrical accumulator. In contrast, eye and hand effector-specific regions in frontoparietal cortex tracked motor intentions but were not modulated by the amount of evidence for the effector outcome. We conclude that item recognition decisions are supported by a combination of symmetrical and asymmetrical accumulation signals largely segregated from motor intentions.

Keywords: decision-making; diffusion models; effector specificity; episodic memory; fMRI; parietal lobe.


Figures

Figure 1.
Figure 1.
Experimental paradigm. A, Example of the visual stimuli used in the psychophysical and the fMRI experiments. In the encoding session, four images for each of 30 indoor and 30 outdoor (“forest” in the example) categories were presented at different frequencies to manipulate encoding strength. EO images were only presented at encoding. At retrieval, old (encoded) images were characterized by increasing levels of evidence (1× <3× <5×) toward old responses. Similarly, there were three types of new images. SR and SPR images were selected from the same categories (“forest” in the example) used in the encoding session: SR images were only semantically related to old images, whereas SPR images were also physically similar to EO images. Finally, U images were chosen from 60 new categories (“countryside” in the example). The manipulation of similarity between old and new images created three levels of increasing evidence toward new responses (SPR < SR < U). Perceived memory strength was supposed to be strongest for 5× old images and weakest for U images. B, fMRI paradigm. Left, Trial structure of the encoding task (fMRI experiment). A warning red fixation cross preceded image onset. Image was presented for 1 s, followed by fixation. Participants provided indoor/outdoor judgments. Right, Trial structure of the retrieval task. An image was presented for 1.5 s along with a left or right peripheral target (white circle). An ∼8 s delay preceded the go-signal for the execution of either a saccade or a pointing movement toward the remembered peripheral target based on the old/new judgment. The association between memory judgment and response effector (J/R association) was counterbalanced across groups (N = 12 each).
Figure 2.
Figure 2.
Behavioral results. A–D, Behavioral data from the psychophysical experiment. A, Recognition times for the six experimental conditions. Old images are shown in warm colors, from red (5×, high evidence) to yellow (1×, low evidence), whereas new images are shown in cool colors, from light (SPR, low) to dark (U, high) blue. Subjects displayed an inverse U-shape function, with faster recognition for high evidence compared with low evidence trials. Error bars indicate SEM. B, Retrieval accuracy. Participants exhibited an expected U-shape function, characterized by higher accuracy for high evidence compared with low evidence trials. C, Perceived memory strength, calculated as the number of old responses divided by the total number of responses. Individual subjects are represented by thin lines, the mean of 15 subjects by the thick line. An almost linear decrease from 5× old to U new items was observed. D, Estimates of the drift rate across subjects for the six experimental conditions obtained by fitting in each individual the DDM parameterization that provided the best fit at the meta-subject level. In this model, only the drift rate was allowed to vary freely across conditions, whereas other parameters remained constant. E, F, Behavioral data from the fMRI experiment. E, Retrieval accuracy. Solid and empty bars represent the two groups with opposite J/R association (A1, A2), characterized by very similar performance. F, Perceived memory strength, separately assessed for the two groups (A1 in gray, A2 in green). The thin lines indicate individual subjects; the thick line represents the mean of 15 subjects.
Figure 3.
Figure 3.
Perceived memory strength. A, The voxelwise map was obtained with a one-sample t test against the baseline on the magnitude of BOLD signal from the decision phase, in which a specific weight was associated to each of the six conditions based on the corresponding individual level of perceived memory strength. The map is superimposed on a flat representation of the PALS atlas (Caret software) (Van Essen, 2005). B, Transversal slice showing the positive response in the striatum. C, The left IPS shows a monotonic response tracking perceived memory strength regardless of the particular J/R association. Location on an inflated PALS representation and time courses of BOLD activity from the IPS region. Time courses of the BOLD signal change compared with baseline for the 14 MR frames after image onset are displayed for the whole group of 24 subjects and separately from subgroups with different J/R associations. The same color code of the behavioral results was used, in which response to correctly recognized old and new items is represented by warm and cool colors, respectively. The vertical dotted line in the middle of each graph separates the decision from the execution phase. Error bars indicate SEM. D, Percent BOLD signal change corresponding to the peak of the decision phase (fourth MR frame) from the IPS region and from other regions of the prefrontal cortex and the striatum that were modulated by perceived memory strength.
Figure 4.
Figure 4.
Recognition accuracy. A, Voxelwise map obtained with a one-sample t test against the baseline in which the weights for the six conditions were based on individual measures of accuracy. Colors from dark to light green indicate voxels showing higher activity for more difficult compared with easier conditions, whereas colors from red to yellow indicate voxels showing higher activity for easier compared with more difficult conditions. B, BOLD activity corresponding to the peak of the decision phase (fourth MR frame) from two regions where activity was greater for easier conditions (A, red clusters). The nonmonotonic response tracking the amount of evidence regardless of the memory status (old/new) only appeared in terms of BOLD deactivations with respect to the baseline. C, Peak of BOLD signal change from four regions showing greater activity for more difficult conditions.
Figure 5.
Figure 5.
Results of the HRF-assumed GLM. A, Voxelwise map of the regions tracking perceived memory strength superimposed on the flat PALS representation of the left hemisphere. B, Voxelwise map of the regions tracking recognition accuracy. C, Sagittal slices showing the left hippocampus cluster that positively tracked recognition accuracy. D, E, Magnitudes (left) and BOLD signal time courses (right) from the left hippocampus.
Figure 6.
Figure 6.
Parietal effector-selective regions. A, Anatomical location (left) and BOLD activity from the independently identified, saccade-selective pIPS region. The map on the left illustrates the degree of overlap (from red to yellow) of the ROIs identified in each participant, superimposed over an inflated cortical representation of both hemispheres. For each of two groups with opposite J/R associations, the time courses and the peak of BOLD activity in the decision phase are shown. The asterisks indicate the time point when the item associated with the preferred movement evoked greater activity compared with the nonpreferred movement: black asterisk: p < 0.01, gray asterisk: p = 0.05 (Duncan post hoc test relative to the MSxJ/RxT interaction of the mixed effect ANOVA). Error bars indicate SEM. B, Location and BOLD activity from the pointing-selective parietal reach region located in the medial PPC.
Figure 7.
Figure 7.
Frontal effector-selective regions. A–C, Location and BOLD activity from the independently selected, effector-specific ROI in the frontal lobe: the saccade-selective frontal eye fields (A) and the point selective frontal reach region (B) and left somatomotor cortex (C). Error bars indicate SEM. Asterisks indicate the time point when the item associated with the preferred movement evoked greater activity compared with nonpreferred movement.
Figure 8.
Figure 8.
Topography of memory-related effects in the parietal lobe. A, Lateral view of the left PPC showing the spatial relationship between the regions that tracked perceived memory strength (red) and the saccade-selective region of the pIPS (green, representing the overlap of all the single subject ROIs). The figure illustrates the substantial segregation of signals related to decisions and motor intentions. The region modulated by recognition accuracy (blue) is also shown. B, The results of the present study were superimposed on the map of BOLD activity in response to episodic memory (red) and perceptual (green) search from a recent study from our laboratory (Sestieri et al., 2010, 2011). The figure shows that the current middle IPS region (black border) overlaps with regions involved in memory, but not perceptual, search that are located outside the DMN (white border). The spatial extent of the DMN, which includes the region modulated by recognition accuracy in the present study (blue border), was independently identified using resting state functional connectivity.

Similar articles

Cited by

References

    1. Astafiev SV, Shulman GL, Stanley CM, Snyder AZ, Van Essen DC, Corbetta M. Functional organization of human intraparietal and frontal cortex for attending, looking, and pointing. J Neurosci. 2003;23:4689–4699. - PMC - PubMed
    1. Boynton GM, Engel SA, Glover GH, Heeger DJ. Linear systems analysis of functional magnetic resonance imaging in human V1. J Neurosci. 1996;16:4207–4221. - PMC - PubMed
    1. Cabeza R, Ciaramelli E, Olson IR, Moscovitch M. The parietal cortex and episodic memory: an attentional account. Nat Rev Neurosci. 2008;9:613–625. doi: 10.1038/nrn2459. - DOI - PMC - PubMed
    1. Chun MM, Golomb JD, Turk-Browne NB. A taxonomy of external and internal attention. Annu Rev Psychol. 2011;62:73–101. doi: 10.1146/annurev.psych.093008.100427. - DOI - PubMed
    1. Cohen AL, Sanborn AN, Shiffrin RM. Model evaluation using grouped or individual data. Psychon Bull Rev. 2008;15:692–712. doi: 10.3758/PBR.15.4.692. - DOI - PubMed

Publication types

LinkOut - more resources