Lysophosphatidic acid acts as a nutrient-derived developmental cue to regulate early hematopoiesis
- PMID: 24829209
- PMCID: PMC4194126
- DOI: 10.15252/embj.201387594
Lysophosphatidic acid acts as a nutrient-derived developmental cue to regulate early hematopoiesis
Abstract
Primitive hematopoiesis occurs in the yolk sac blood islands during vertebrate embryogenesis, where abundant phosphatidylcholines (PC) are available as important nutrients for the developing embryo. However, whether these phospholipids also generate developmental cues to promote hematopoiesis is largely unknown. Here, we show that lysophosphatidic acid (LPA), a signaling molecule derived from PC, regulated hemangioblast formation and primitive hematopoiesis. Pharmacological and genetic blockage of LPA receptor 1 (LPAR1) or autotoxin (ATX), a secretory lysophospholipase that catalyzes LPA production, inhibited hematopoietic differentiation of mouse embryonic stem cells and impaired the formation of hemangioblasts. Mechanistic experiments revealed that the regulatory effect of ATX-LPA signaling was mediated by PI3K/Akt-Smad pathway. Furthermore, during in vivo embryogenesis in zebrafish, LPA functioned as a developmental cue for hemangioblast formation and primitive hematopoiesis. Taken together, we identified LPA as an important nutrient-derived developmental cue for primitive hematopoiesis as well as a novel mechanism of hemangioblast regulation.
Keywords: LPA; embryonic stem cell; hemangioblast; hematopoiesis; zebrafish.
© 2014 The Authors.
Figures


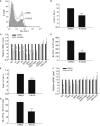
Representative flow cytometry data for Flk1 staining in day 4 whole EBs. EBs were treated with DMSO or 30 μM Ki16425 from day 2 to day 4 and analyzed by flow cytometry.
Effect of Ki16425 treatment on Flk1+ cell percentage (n = 5).
qPCR analyses of hematopoietic and germ layer marker expressions (n = 4). Endoderm marker: lamb1; mesoderm marker: brachyury; ectoderm marker: beta-tub3.
BL-CFC assay. Day 4 EBs treated as in (A) were digested with trypsin and cultured in BL-CFC medium. Blast colonies were identified and scored by their distinctive morphology 4 days later (n = 4).
Effect of HA130 on Flk1+ cell percentage (n = 4).
qPCR analyses of hematopoietic and germ layer marker expressions (n = 3).
BL-CFC assay (n = 3). Blast colonies were cultured and scored as in (D).

Effects of lpar1 and/or lpar3 knockdown on Flk1+ cell percentage in day 4 whole EBs (n = 4).
qPCR analyses of hematopoietic and germ layer marker expressions (n = 4).
BL-CFC assay. Day 4 EBs were digested with trypsin and cultured in BL-CFC medium. Blast colonies were identified and scored 4 days later (n = 3).
Effect of atx knockdown on Flk1+ cell percentage (n = 3).
qPCR analyses of hematopoietic and germ layer marker expressions (n = 4).
BL-CFC assay (n = 4). Blast colonies were cultured and scored as in (C).


Similar articles
-
Autotaxin regulates vascular development via multiple lysophosphatidic acid (LPA) receptors in zebrafish.J Biol Chem. 2011 Dec 23;286(51):43972-43983. doi: 10.1074/jbc.M111.301093. Epub 2011 Oct 4. J Biol Chem. 2011. PMID: 21971049 Free PMC article.
-
Overexpression of autotaxin, a lysophosphatidic acid-producing enzyme, enhances cardia bifida induced by hypo-sphingosine-1-phosphate signaling in zebrafish embryo.J Biochem. 2014 Apr;155(4):235-41. doi: 10.1093/jb/mvt114. Epub 2014 Jan 21. J Biochem. 2014. PMID: 24451492
-
Autotaxin/Lpar3 signaling regulates Kupffer's vesicle formation and left-right asymmetry in zebrafish.Development. 2012 Dec 1;139(23):4439-48. doi: 10.1242/dev.081745. Epub 2012 Oct 24. Development. 2012. PMID: 23095890
-
Autotaxin and LPA receptor signaling in cancer.Cancer Metastasis Rev. 2011 Dec;30(3-4):557-65. doi: 10.1007/s10555-011-9319-7. Cancer Metastasis Rev. 2011. PMID: 22002750 Review.
-
Autotaxin in embryonic development.Biochim Biophys Acta. 2013 Jan;1831(1):13-9. doi: 10.1016/j.bbalip.2012.09.013. Epub 2012 Sep 28. Biochim Biophys Acta. 2013. PMID: 23022664 Review.
Cited by
-
Dynamics of Endothelial Cell Diversity and Plasticity in Health and Disease.Cells. 2024 Jul 29;13(15):1276. doi: 10.3390/cells13151276. Cells. 2024. PMID: 39120307 Free PMC article. Review.
-
Lysophosphatidic Acid and Hematopoiesis: From Microenvironmental Effects to Intracellular Signaling.Int J Mol Sci. 2020 Mar 16;21(6):2015. doi: 10.3390/ijms21062015. Int J Mol Sci. 2020. PMID: 32188052 Free PMC article. Review.
-
Hematopoietic Stem Cells and Their Niche in Bone Marrow.Int J Mol Sci. 2024 Jun 21;25(13):6837. doi: 10.3390/ijms25136837. Int J Mol Sci. 2024. PMID: 38999948 Free PMC article. Review.
-
Autotaxin, a lysophospholipase D with pleomorphic effects in oncogenesis and cancer progression.J Lipid Res. 2016 Jan;57(1):25-35. doi: 10.1194/jlr.R060020. Epub 2015 May 14. J Lipid Res. 2016. PMID: 25977291 Free PMC article. Review.
-
The Role of Lysophosphatidic Acid in Adult Stem Cells.Int J Stem Cells. 2020 Jul 30;13(2):182-191. doi: 10.15283/ijsc20035. Int J Stem Cells. 2020. PMID: 32587135 Free PMC article. Review.
References
-
- Allende ML, Yamashita T, Proia RL. G-protein-coupled receptor S1P1 acts within endothelial cells to regulate vascular maturation. Blood. 2003;102:3665–3667. - PubMed
-
- Anliker B, Chun J. Lysophospholipid G protein-coupled receptors. J Biol Chem. 2004;279:20555–20558. - PubMed
-
- Chiang CL, Chen SS, Lee SJ, Tsao KC, Chu PL, Wen CH, Hwang SM, Yao CL, Lee H. Lysophosphatidic acid induces erythropoiesis through activating lysophosphatidic acid receptor 3. Stem Cells. 2011;29:1763–1773. - PubMed
Publication types
MeSH terms
Substances
LinkOut - more resources
Full Text Sources
Other Literature Sources
Molecular Biology Databases
Miscellaneous

