

Simulated shift work in rats perturbs multiscale regulation of locomotor activity
- PMID: 24829282
- PMCID: PMC4032547
- DOI: 10.1098/rsif.2014.0318
Simulated shift work in rats perturbs multiscale regulation of locomotor activity
Abstract
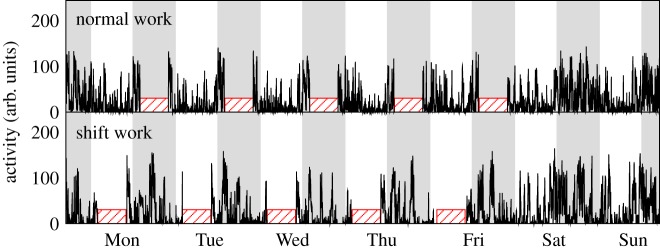
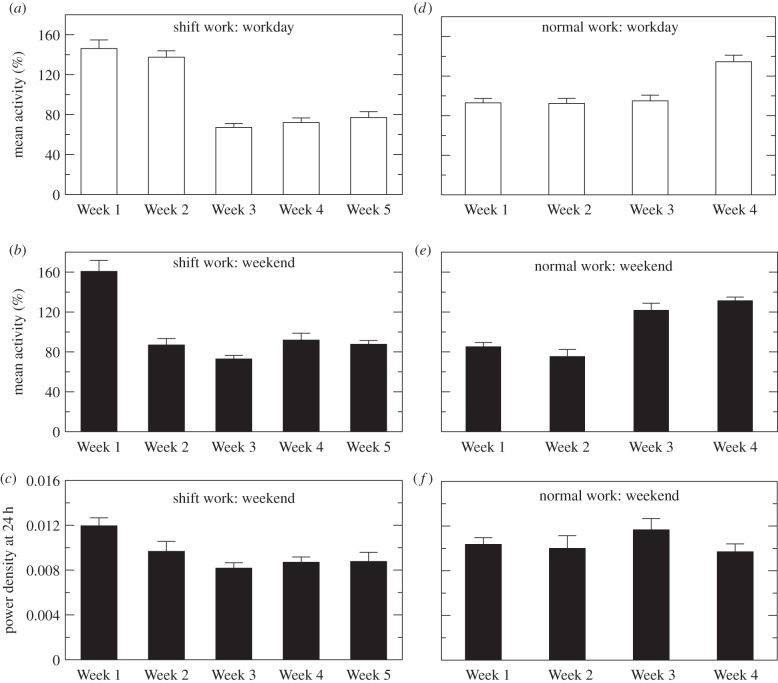
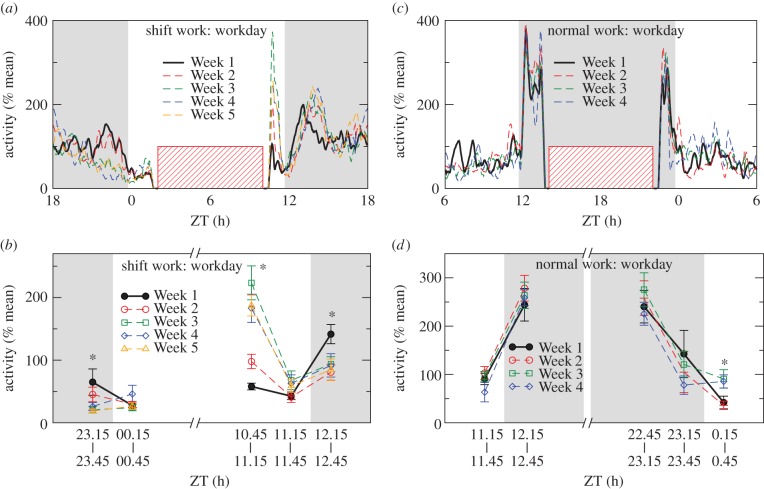
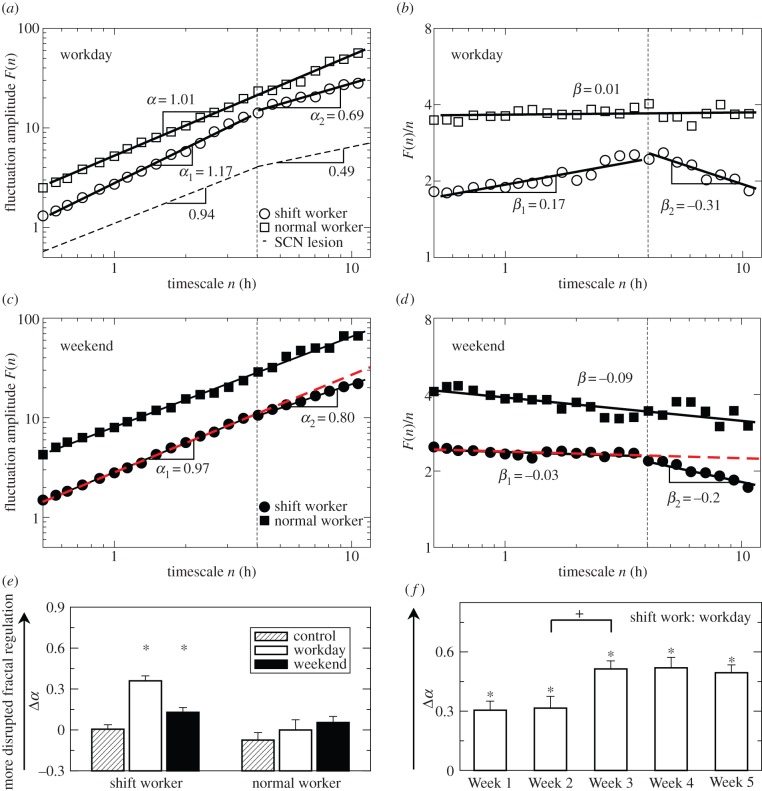
Motor activity possesses a multiscale regulation that is characterized by fractal activity fluctuations with similar structure across a wide range of timescales spanning minutes to hours. Fractal activity patterns are disturbed in animals after ablating the master circadian pacemaker (suprachiasmatic nucleus, SCN) and in humans with SCN dysfunction as occurs with aging and in dementia, suggesting the crucial role of the circadian system in the multiscale activity regulation. We hypothesized that the normal synchronization between behavioural cycles and the SCN-generated circadian rhythms is required for multiscale activity regulation. To test the hypothesis, we studied activity fluctuations of rats in a simulated shift work protocol that was designed to force animals to be active during the habitual resting phase of the circadian/daily cycle. We found that these animals had gradually decreased mean activity level and reduced 24-h activity rhythm amplitude, indicating disturbed circadian and behavioural cycles. Moreover, these animals had disrupted fractal activity patterns as characterized by more random activity fluctuations at multiple timescales from 4 to 12 h. Intriguingly, these activity disturbances exacerbated when the shift work schedule lasted longer and persisted even in the normal days (without forced activity) following the shift work. The disrupted circadian and fractal patterns resemble those of SCN-lesioned animals and of human patients with dementia, suggesting a detrimental impact of shift work on multiscale activity regulation.
Keywords: circadian misalignment; multiscale regulation; shift work.
© 2014 The Author(s) Published by the Royal Society. All rights reserved.
Figures
Similar articles
-
Fractal patterns of neural activity exist within the suprachiasmatic nucleus and require extrinsic network interactions.PLoS One. 2012;7(11):e48927. doi: 10.1371/journal.pone.0048927. Epub 2012 Nov 20. PLoS One. 2012. PMID: 23185285 Free PMC article.
-
The circadian pacemaker generates similar circadian rhythms in the fractal structure of heart rate in humans and rats.Cardiovasc Res. 2008 Oct 1;80(1):62-8. doi: 10.1093/cvr/cvn150. Epub 2008 Jun 6. Cardiovasc Res. 2008. PMID: 18539630 Free PMC article.
-
Interactive Effects of Dorsomedial Hypothalamic Nucleus and Time-Restricted Feeding on Fractal Motor Activity Regulation.Front Physiol. 2016 May 18;7:174. doi: 10.3389/fphys.2016.00174. eCollection 2016. Front Physiol. 2016. PMID: 27242548 Free PMC article.
-
SCN VIP Neurons Are Essential for Normal Light-Mediated Resetting of the Circadian System.J Neurosci. 2018 Sep 12;38(37):7986-7995. doi: 10.1523/JNEUROSCI.1322-18.2018. Epub 2018 Aug 6. J Neurosci. 2018. PMID: 30082421 Free PMC article.
-
Living by the clock: the circadian pacemaker in older people.Ageing Res Rev. 2006 Feb;5(1):33-51. doi: 10.1016/j.arr.2005.07.001. Epub 2005 Aug 25. Ageing Res Rev. 2006. PMID: 16126012 Review.
Cited by
-
The Cost of Activity during the Rest Phase: Animal Models and Theoretical Perspectives.Front Endocrinol (Lausanne). 2018 Mar 7;9:72. doi: 10.3389/fendo.2018.00072. eCollection 2018. Front Endocrinol (Lausanne). 2018. PMID: 29563894 Free PMC article.
-
Lack of exercise leads to significant and reversible loss of scale invariance in both aged and young mice.Proc Natl Acad Sci U S A. 2015 Feb 24;112(8):2320-4. doi: 10.1073/pnas.1424706112. Epub 2015 Feb 9. Proc Natl Acad Sci U S A. 2015. PMID: 25675516 Free PMC article.
-
Unpredictable disturbance and its effects on activity behavior and lifespan in Drosophila melanogaster.Biol Open. 2025 Jul 15;14(7):bio062071. doi: 10.1242/bio.062071. Epub 2025 Jul 22. Biol Open. 2025. PMID: 40554766 Free PMC article.
-
Interaction between the progression of Alzheimer's disease and fractal degradation.Neurobiol Aging. 2019 Nov;83:21-30. doi: 10.1016/j.neurobiolaging.2019.08.023. Epub 2019 Aug 30. Neurobiol Aging. 2019. PMID: 31585364 Free PMC article.
-
Range Measurement and a Habitat Suitability Map for the Norway Rat in a Highly Developed Urban Environment.Trop Life Sci Res. 2015 Dec;26(2):27-44. Trop Life Sci Res. 2015. PMID: 26868708 Free PMC article.
References
-
- Amaral LAN, et al. 2004. Power law temporal auto-correlations in day-long records of human physical activity and their alteration with disease. Europhys. Lett. 66, 448–454. (10.1209/epl/i2003-10227-7) - DOI
Publication types
MeSH terms
Grants and funding
- K24 HL076446/HL/NHLBI NIH HHS/United States
- P01AG009975/AG/NIA NIH HHS/United States
- K99-HL102241/HL/NHLBI NIH HHS/United States
- K99 HL102241/HL/NHLBI NIH HHS/United States
- P30 HL101299/HL/NHLBI NIH HHS/United States
- R01-HL094806/HL/NHLBI NIH HHS/United States
- R01 HL094806/HL/NHLBI NIH HHS/United States
- T32-HL07901/HL/NHLBI NIH HHS/United States
- R00 HL102241/HL/NHLBI NIH HHS/United States
- K24-HL76446/HL/NHLBI NIH HHS/United States
- P01 AG009975/AG/NIA NIH HHS/United States
- P30-HL101299/HL/NHLBI NIH HHS/United States
- R00-HL102241/HL/NHLBI NIH HHS/United States
LinkOut - more resources
Full Text Sources
Other Literature Sources
