

Resolution of telomere associations by TRF1 cleavage in mouse embryonic stem cells
- PMID: 24829382
- PMCID: PMC4072570
- DOI: 10.1091/mbc.E13-10-0564
Resolution of telomere associations by TRF1 cleavage in mouse embryonic stem cells
Abstract
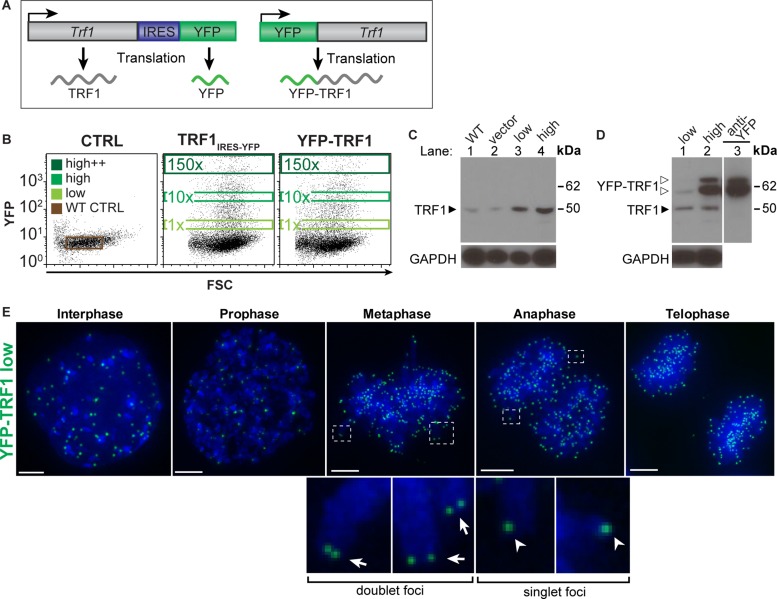
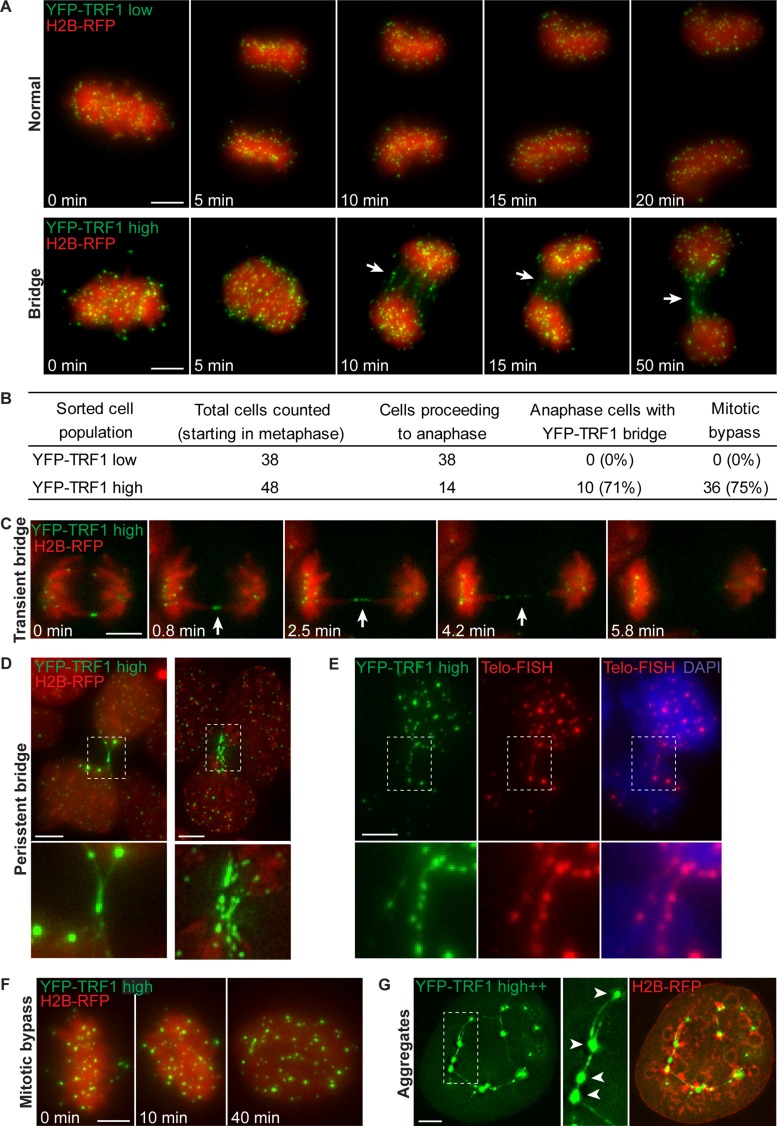
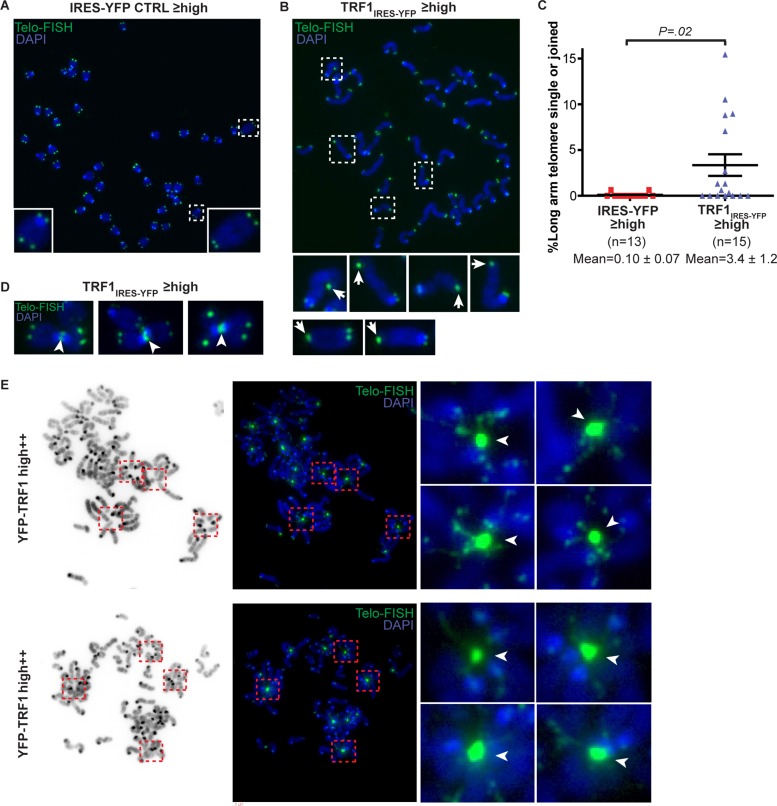
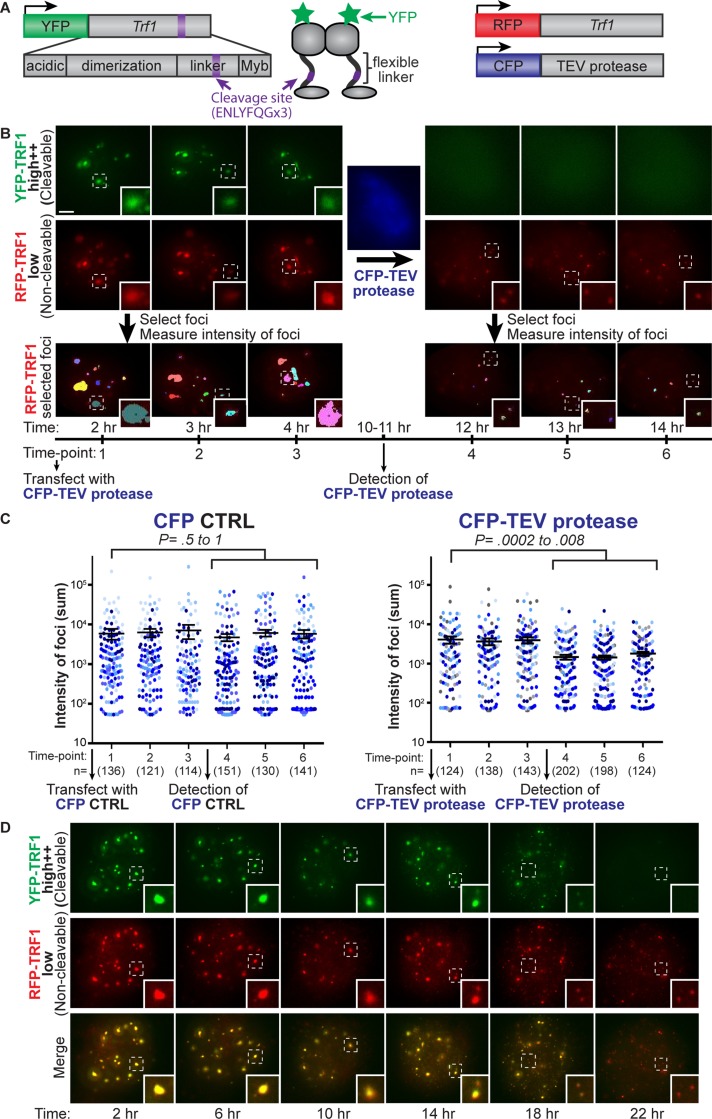
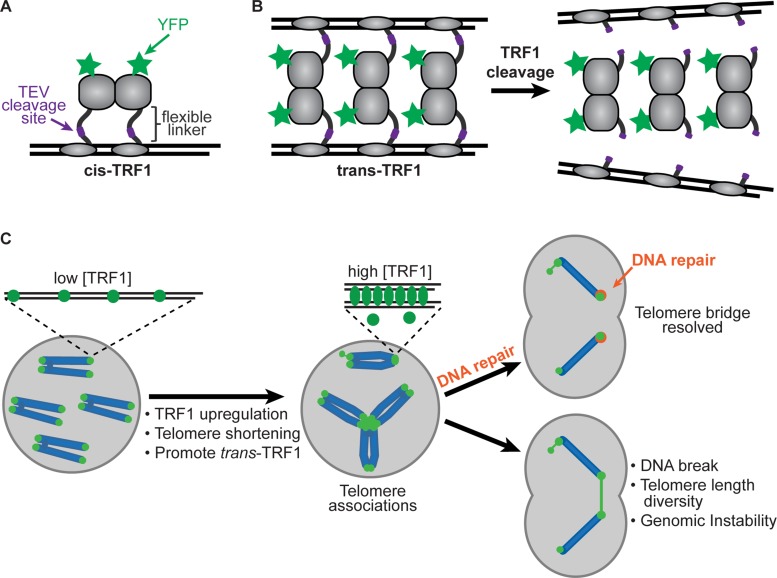
Telomere associations have been observed during key cellular processes such as mitosis, meiosis, and carcinogenesis and must be resolved before cell division to prevent genome instability. Here we establish that telomeric repeat-binding factor 1 (TRF1), a core component of the telomere protein complex, is a mediator of telomere associations in mammalian cells. Using live-cell imaging, we show that expression of TRF1 or yellow fluorescent protein (YFP)-TRF1 fusion protein above endogenous levels prevents proper telomere resolution during mitosis. TRF1 overexpression results in telomere anaphase bridges and aggregates containing TRF1 protein and telomeric DNA. Site-specific protein cleavage of YFP-TRF1 by tobacco etch virus protease resolves telomere aggregates, indicating that telomere associations are mediated by TRF1. This study provides novel insight into the formation and resolution of telomere associations.
© 2014 Lisaingo et al. This article is distributed by The American Society for Cell Biology under license from the author(s). Two months after publication it is available to the public under an Attribution–Noncommercial–Share Alike 3.0 Unported Creative Commons License (http://creativecommons.org/licenses/by-nc-sa/3.0).
Figures
Similar articles
-
TRFH domain is critical for TRF1-mediated telomere stabilization.Cell Struct Funct. 2009;34(2):71-6. doi: 10.1247/csf.09007. Epub 2009 Jun 11. Cell Struct Funct. 2009. PMID: 19521025
-
TopoIIα prevents telomere fragility and formation of ultra thin DNA bridges during mitosis through TRF1-dependent binding to telomeres.Cell Cycle. 2014;13(9):1463-81. doi: 10.4161/cc.28419. Epub 2014 Mar 10. Cell Cycle. 2014. PMID: 24626180 Free PMC article.
-
Nucleolar modulation of TRF1: a dynamic way to regulate telomere and cell cycle by nucleostemin and GNL3L.Cell Cycle. 2009 Sep 15;8(18):2912-6. doi: 10.4161/cc.8.18.9543. Epub 2009 Sep 16. Cell Cycle. 2009. PMID: 19713769 Free PMC article. Review.
-
Importance of TRF1 for functional telomere structure.J Biol Chem. 2004 Jan 9;279(2):1442-8. doi: 10.1074/jbc.M309138200. Epub 2003 Oct 14. J Biol Chem. 2004. PMID: 14559908
-
Post-translational modifications of TRF1 and TRF2 and their roles in telomere maintenance.Mech Ageing Dev. 2012 Jun;133(6):421-34. doi: 10.1016/j.mad.2012.05.002. Epub 2012 May 23. Mech Ageing Dev. 2012. PMID: 22634377 Review.
Cited by
-
E-type cyclins modulate telomere integrity in mammalian male meiosis.Chromosoma. 2016 Jun;125(2):253-64. doi: 10.1007/s00412-015-0564-3. Epub 2015 Dec 28. Chromosoma. 2016. PMID: 26712234 Free PMC article.
-
Identifying proteins bound to native mitotic ESC chromosomes reveals chromatin repressors are important for compaction.Nat Commun. 2020 Aug 17;11(1):4118. doi: 10.1038/s41467-020-17823-z. Nat Commun. 2020. PMID: 32807789 Free PMC article.
-
The Genomic Health of Human Pluripotent Stem Cells: Genomic Instability and the Consequences on Nuclear Organization.Front Genet. 2019 Jan 21;9:623. doi: 10.3389/fgene.2018.00623. eCollection 2018. Front Genet. 2019. PMID: 30719030 Free PMC article. Review.
-
Telomere fusions and translocations: a bridge too far?Curr Opin Genet Dev. 2020 Feb;60:85-91. doi: 10.1016/j.gde.2020.02.010. Epub 2020 Mar 13. Curr Opin Genet Dev. 2020. PMID: 32171975 Free PMC article. Review.
-
Cell Biology of Giant Cell Tumour of Bone: Crosstalk between m/wt Nucleosome H3.3, Telomeres and Osteoclastogenesis.Cancers (Basel). 2021 Oct 13;13(20):5119. doi: 10.3390/cancers13205119. Cancers (Basel). 2021. PMID: 34680268 Free PMC article. Review.
References
-
- Aladjem MI, Spike BT, Rodewald LW, Hope TJ, Klemm M, Jaenisch R, Wahl GM. ES cells do not activate p53-dependent stress responses and undergo p53-independent apoptosis in response to DNA damage. Curr Biol. 1998;8:145–155. - PubMed
-
- Azzalin CM, Lingner J. Cell biology. Telomere wedding ends in divorce. Science. 2004;304:60–62. - PubMed
Publication types
MeSH terms
Substances
LinkOut - more resources
Full Text Sources
Other Literature Sources
Molecular Biology Databases
