. 2014 Jun 15;192(12):6009-19.
doi: 10.4049/jimmunol.1303492. Epub 2014 May 14.

mTOR signaling inhibition modulates macrophage/microglia-mediated neuroinflammation and secondary injury via regulatory T cells after focal ischemia

Affiliations

mTOR signaling inhibition modulates macrophage/microglia-mediated neuroinflammation and secondary injury via regulatory T cells after focal ischemia

Luokun Xie et al. J Immunol. .

Abstract

Signaling by the mammalian target of rapamycin (mTOR) plays an important role in the modulation of both innate and adaptive immune responses. However, the role and underlying mechanism of mTOR signaling in poststroke neuroinflammation are largely unexplored. In this study, we injected rapamycin, a mTOR inhibitor, by the intracerebroventricular route 6 h after focal ischemic stroke in rats. We found that rapamycin significantly reduced lesion volume and improved behavioral deficits. Notably, infiltration of γδ T cells and granulocytes, which are detrimental to the ischemic brain, was profoundly reduced after rapamycin treatment, as was the production of proinflammatory cytokines and chemokines by macrophages and microglia. Rapamycin treatment prevented brain macrophage polarization toward the M1 type. In addition, we also found that rapamycin significantly enhanced anti-inflammation activity of regulatory T cells (Tregs), which decreased production of proinflammatory cytokines and chemokines by macrophages and microglia. Depletion of Tregs partially elevated macrophage/microglia-induced neuroinflammation after stroke. Our data suggest that rapamycin can attenuate secondary injury and motor deficits after focal ischemia by enhancing the anti-inflammation activity of Tregs to restrain poststroke neuroinflammation.


Figures

Figure 1
Figure 1. Rapamycin treatment reduced lesion volume and improved motor deficits after MCAO
(A) The scheme of experimental design. (B) Crystal violet-stained coronal brain sections from rapamycin- and vehicle-treated ischemic rats. (C) Volume loss in vehicle- and rapamycin-treated rats (N=7 per group). (D) Neurobehavioral tests (sham group: n=6~7; MCAO group: n=10~11). Left: Beam-walking test scores, expressed as the mean numbers of forelimb slip steps when traversing an elevated narrow beam; middle: Limb-placing test scores, expressed as a score derived from the number of correct limb placements; right: Elevated body swing test scores, expressed as a percentage of turns to the contralesional (impaired) side. Veh, vehicle; Rapa, rapamycin. *, p<0.05 compared to vehicle-treated rats.
Figure 2
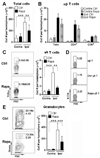
Figure 2. Rapamycin treatment reduced inflammatory cell infiltration after MCAO
(A) The number of total immune cells recovered from ischemic brains. (B) αβ T cell number in ischemic brains. (C) γδ T cell number in ischemic brains. Left: representative contour plots of brain γδ T cells. Right: statistical analysis of γδ T cell infiltrates. (D) Flow cytometry analysis of IL-17A expression in infiltrated T cells. αβ T, αβ T cells; Ctrl γδ T, γδ T cells in brains of vehicle-treated rats; Rapa γδ T, γδ T cells in brains of rapamycin-treated rats. This is a representative of three independent experiments. (E) Granulocyte number in ischemic brains. Left: representative contour plots of brain granulocytes. Right: statistical analysis of granulocyte infiltrates. Numbers in the plots are the frequencies of each population in total recovered immune cells. Ctrl, vehicle control; Rapa, Rapamycin-treated; Contra, contralateral side; Ipsi, ipsilateral side. N=8 rats per group. **, p<0.01; ***, p<0.001.
Figure 3
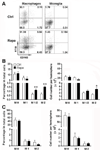
Figure 3. Rapamycin treatment inhibited pro-inflammatory activity of macrophages and microglia
(A) Macrophages and microglia in ischemic brains. Left: representative dot plots of flow cytometry analysis showing brain macrophages and microglia. Total isolated cells were gated according to CD45 and CD11b/c expression. Numbers in the plots are the frequencies of each population in total recovered immune cells. Right: the number of macrophages and microglia in ischemic brains with or without rapamycin treatment, respectively. Contra, contralateral side; Ipsi, ipsilateral side. ***, p<0.001. (B) Q-RTPCR for mRNA levels of cytokines and chemokines in brain macrophages and microglia after MCAO. N=6 rats per group. Ctrl, vehicle control; Rapa, Rapamycin-treated rats. *, p<0.05; **, p<0.01; ***, p<0.001. (C) In vitro migration of γδ T cells induced by macrophages and microglia. Left: representative contour plots of flow cytometry analysis showing the gating strategy. γδ T cells were firstly gated based on FSC and SSC, then were further gated by CD3 expression. Right: the number of γδ T cells migrating to the lower wells. Medium, random migration of γδ T cells without macrophages or microglia in the lower wells. Macrophages, migration of γδ T cells induced by macrophages. Microglia, migration of γδ T cells induced by microglia. N=3 per group. ##, p<0.01 compared with medium only; ###, p<0.001 compared with medium only; *, p<0.05 compared with migration induced by macrophages or microglia isolated from vehicle-treated rats.
Figure 4
Figure 4. Rapamycin treatment enhanced brain macrophage polarization into type M2
(A) Representative dot plots of polarization of brain macrophages and microglia. Macrophages and microglia were gated as in Figure 3A. Then each population was further divided according to MHC-II and CD163 expression. Numbers are the frequency of each population in their parental population. (B) Statistical analysis of frequency (left) and cell number (right) of each macrophage subtype. (C) Statistical analysis of frequency (left) and cell number (right) of each microglia subtype. Ctrl, vehicle control; Rapa, Rapamycin-treated. All data are from ipsilatreal hemispheres. N=6~8 per group. *, p<0.05; **, p<0.01 compared with control group.
Figure 5
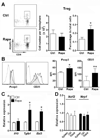
Figure 5. Rapamycin administration enhanced Treg proportion and activity after MCAO
(A) Foxp3+ Treg number and proportion in ischemic brains. Left: representative dot plots of Foxp3+ cells gated on CD3+CD4+ T cells in ischemic brains. Right: statistical analysis of Treg number and frequency. N=5 per group. (B) Rapamcin treatment enhanced expression of Foxp3 and CD25 in infiltrating Tregs. Left: representative histograms of Foxp3 and CD25 in Foxp3+ T cells. Dotted curve, isotype control; shaded curve, vehicle-treated rats; solid curve, rapamycin-treated rats. Right: statistical analysis of the mean fluorescence intensity of Foxp3 and CD25. N=5 per group. (C) Anti-inflammatory cytokine production in Tregs. Ctrl, vehicle control; Rapa, rapamycin-treated rats. Data were from ipsilatreal hemispheres. N=5~6 per group. *, p<0.05. **, p<0.01. (D) Expression of helios and neuropilin-1 in Tregs detected by Q-RTPCR. Spleen, splenic Tregs; Ctrl, Tregs from vehicle control rat brains; Rapa, Tregs from rapamycin-treated rat brains. N=3 per group.
Figure 6
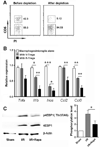
Figure 6. Tregs in rapamycin-treated rat brains potently inhibited inflammatory response of macrophages/microglia
(A) Magnetic cell sorting effectively depleted Tregs from the co-culture. PI live cells were detected for expression of CD5. (B) Cytokine/chemokine production in machophages/microglia after co-culture with Tregs. Ctrl: vehicle control; Rapa: Rapamycin-treated rats. N=5 per group. V-Tregs, Tregs from vehicle-treated brains; R-Tregs, Tregs from rapamycin-treated brains. (C) Phosphorylation of 4EBP1 in immune cells in ischemic brains. This is a representative of three independent experiments. I/R, ischemia/perfusion; Rapa, rapamycin-treated. N=4 per group. *, p<0.05; **, p<0.01; ***, p<0.001.
Figure 7
Figure 7. Depletion of Tregs partially promotes inflammatory response of macrophage/microglia in rapamycin-treated ischemic brains
(A) The scheme of experimental design. Anti-CD25 Ab was injected once a day for 2 days before MCAO and rapamycin treatment. On day 5 after the initial injection of Ab, rats were sacrificed for testing neuroinflammation. (B) Depletion of CD4+Foxp3+ T cells in the blood on day 3 and day 5 after Ab injection. CD3+CD4+ cells were gated for detecting Foxp3+ cells. The numbers in the plots are the frequencies of Foxp3+ cells in CD4+ T cells. This is a representative of two independent experiments. V, PBS (Vehicle) injection; Ab, Ab injection. (C) Decrease of infiltrated Tregs in ischemic brains after Treg depletion. CD3+ cells were gated for detecting CD4+Foxp3+ cells. Left, representative dot plot of infiltrated Tregs after MCAO. Right, number of infiltrated Tregs in ipsilateral hemispheres. Rapa+V, PBS injection before MCAO and rapamycin treatment. Rapa+Ab, Ab injection before MCAO and rapamycin treatment. N=4 per group. *, p<0.05. (D~F) The number of total immune cells (D), αβ T cells, γδ T cells, granulocytes (E), macrophages and microglia (F) in the ipsilateral hemispheres. Ctrl, control group (MCAO without additional treatment). Rapa+V, Vehicle injection before MCAO and rapamycin treatment. Rapa+Ab, Ab injection before MCAO and rapamycin treatment. N=4 per group. *, p<0.05 compared with control group. **, p<0.01 compared with control group. #, p<0.05 compared with Rapa+V group. (G) Cytokine and chemokine expression in infiltrated CD11b/c+ myeloid cells. N=4 per group. *, p<0.05 compared with control group. **, p<0.01 compared with control group. ***, p<0.001 compared with control group. #, p<0.05 compared with Rapa+V group. ##, p<0.01 compared with Rapa+V group. (H) Treg depletion did not affect macrophage phenotype. This is a representative of two independent experiments. The figure in each quadrant is the frequency of each subpopulation of macrophages.

References

    1. Go AS, Mozaffarian D, Roger VL, Benjamin EJ, Berry JD, Blaha MJ, Dai S, Ford ES, Fox CS, Franco S, Fullerton HJ, Gillespie C, Hailpern SM, Heit JA, Howard VJ, Huffman MD, Judd SE, Kissela BM, Kittner SJ, Lackland DT, Lichtman JH, Lisabeth LD, Mackey RH, Magid DJ, Marcus GM, Marelli A, Matchar DB, McGuire DK, Mohler ER, 3rd, Moy CS, Mussolino ME, Neumar RW, Nichol G, Pandey DK, Paynter NP, Reeves MJ, Sorlie PD, Stein J, Towfighi A, Turan TN, Virani SS, Wong ND, Woo D, Turner MB. Heart disease and stroke statistics--2014 update: a report from the American Heart Association. Circulation. 2014;129:e28–e292. - PMC - PubMed
    1. Brott T, Bogousslavsky J. Treatment of acute ischemic stroke. N Engl J Med. 2000;343:710–722. - PubMed
    1. Wang Y, Zhang Z, Chow N, Davis TP, Griffin JH, Chopp M, Zlokovic BV. An activated protein C analog with reduced anticoagulant activity extends the therapeutic window of tissue plasminogen activator for ischemic stroke in rodents. Stroke; a journal of cerebral circulation. 2012;43:2444–2449. - PMC - PubMed
    1. Wechsler LR, Jovin TG. Intravenous recombinant tissue-type plasminogen activator in the extended time window and the US Food and Drug Administration: confused about the time. Stroke; a journal of cerebral circulation. 2012;43:2517–2519. - PubMed
    1. Jin R, Yang G, Li G. Inflammatory mechanisms in ischemic stroke: role of inflammatory cells. J Leukoc Biol. 2010;87:779–789. - PMC - PubMed

Publication types

MeSH terms