. 2014 Jul;42(Web Server issue):W285-9.
doi: 10.1093/nar/gku397. Epub 2014 May 14.

PRISM: a web server and repository for prediction of protein-protein interactions and modeling their 3D complexes

Affiliations

PRISM: a web server and repository for prediction of protein-protein interactions and modeling their 3D complexes

Alper Baspinar et al. Nucleic Acids Res. 2014 Jul.

Abstract

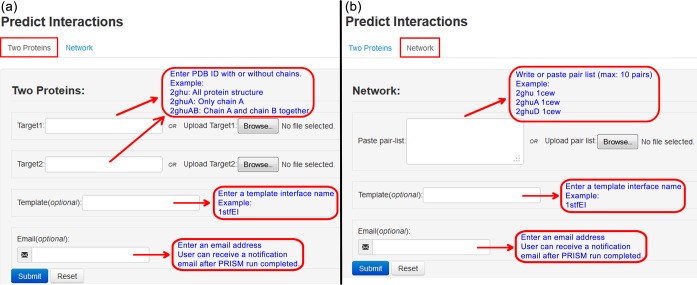
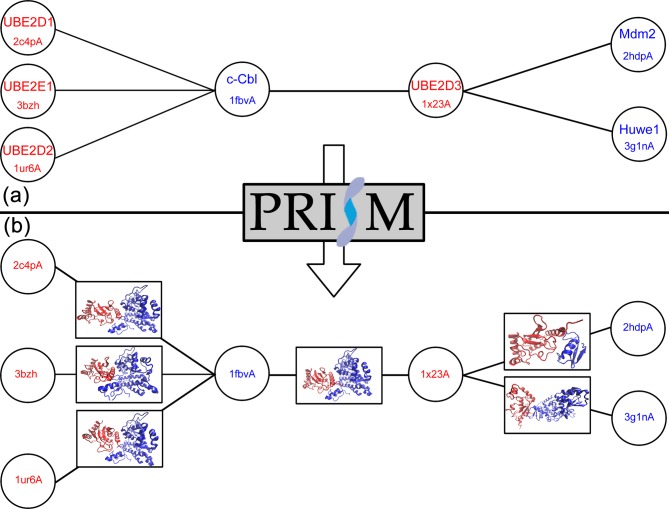
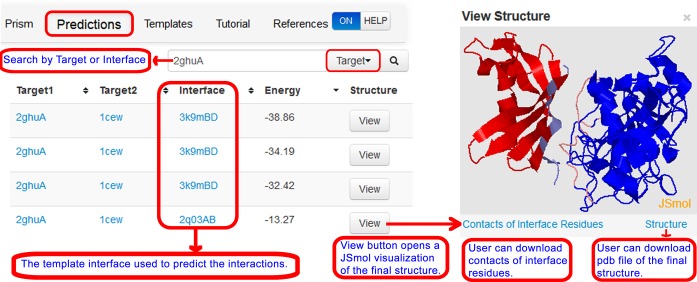
The PRISM web server enables fast and accurate prediction of protein-protein interactions (PPIs). The prediction algorithm is knowledge-based. It combines structural similarity and accounts for evolutionary conservation in the template interfaces. The predicted models are stored in its repository. Given two protein structures, PRISM will provide a structural model of their complex if a matching template interface is available. Users can download the complex structure, retrieve the interface residues and visualize the complex model. The PRISM web server is user friendly, free and open to all users at http://cosbi.ku.edu.tr/prism.


Figures

Figure 1.
Figure 1.
Overview of PRISM main page. (a) Two proteins interaction prediction. (b) Network interaction prediction.
Figure 2.
Figure 2.
Modeling a small network of protein–protein interactions. (a) A node-edge protein–protein interaction network representation of the proteins (UBE2D1, UBE2E1, UBE2D2, UBE2D3, c-Cbl, Mdm2 and Huwe1) is taken from the ubiquitination pathway. (b) Six pairs of proteins are given to network prediction task and the results are shown in network representation of proteins as nodes and protein–protein interactions as edges. These proteins and their predicted complexes are shown in boxes.
Figure 3.
Figure 3.
Overview of the prediction results. Users can search the results by target or interface. The targets’ proteins are shown in Target1 and Target2 columns. Interface column shows the template interface name. Energy column shows the FiberDock (18) energy value of the final structure. View button opens a JSmol (25) visualization of the final structure.

References

    1. Venkatesan K., Rual J.F., Vazquez A., Stelzl U., Lemmens I., Hirozane-Kishikawa T., Hao T., Zenkner M., Xin X., Goh K.I., et al. An empirical framework for binary interactome mapping. Nat. Methods. 2009;6:83–90. - PMC - PubMed
    1. Stumpf M.P., Thorne T., de Silva E., Stewart R., An H.J., Lappe M., Wiuf C. Estimating the size of the human interactome. Proc. Natl. Acad. Sci. U.S.A. 2008;105:6959–6964. - PMC - PubMed
    1. Mosca R., Ceol A., Aloy P. Interactome3D: adding structural details to protein networks. Nat. Methods. 2013;10:47–53. - PubMed
    1. Tyagi M., Hashimoto K., Shoemaker B.A., Wuchty S., Panchenko A.R. Large-scale mapping of human protein interactome using structural complexes. EMBO Rep. 2012;13:266–271. - PMC - PubMed
    1. Kuzu G., Keskin O., Gursoy A., Nussinov R. Constructing structural networks of signaling pathways on the proteome scale. Curr. Opin. Struct. Biol. 2012;22:367–377. - PubMed

Publication types

Substances