

Toward body composition reference data for infants, children, and adolescents
- PMID: 24829484
- PMCID: PMC4013189
- DOI: 10.3945/an.113.005371
Toward body composition reference data for infants, children, and adolescents
Abstract
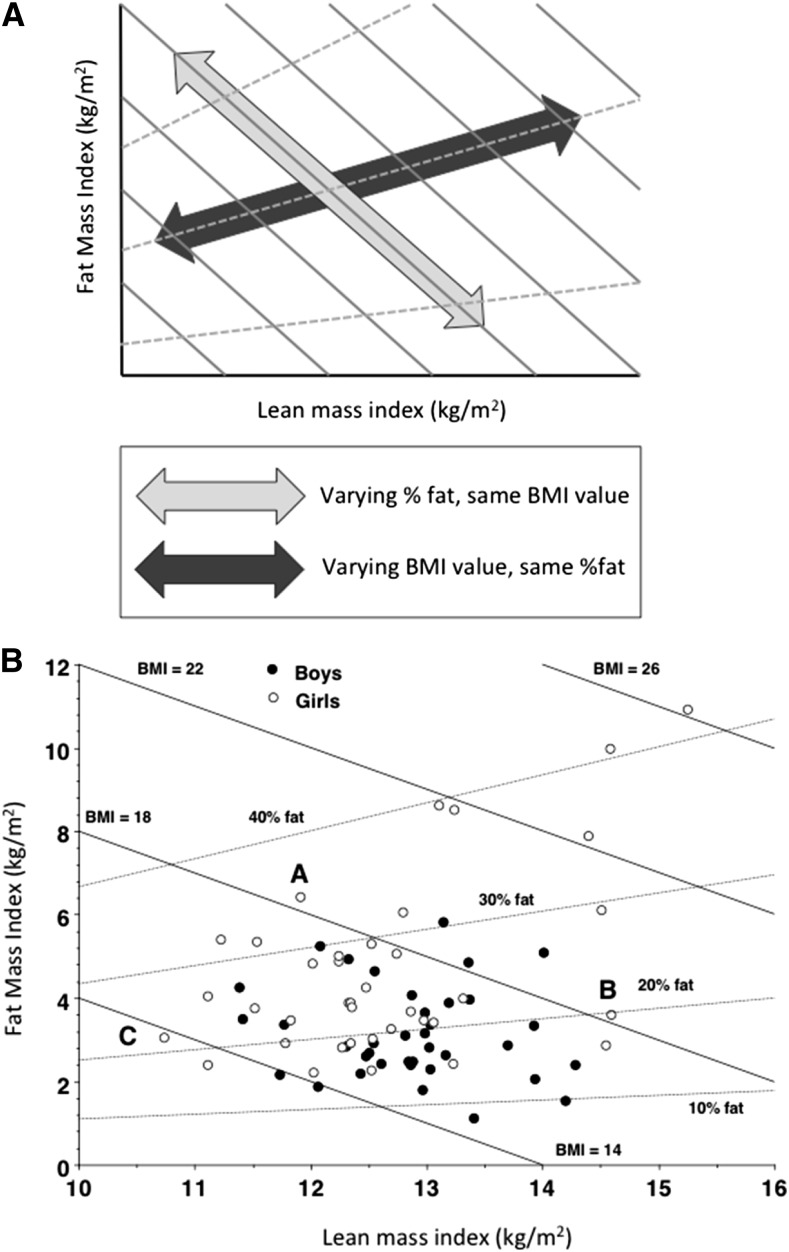
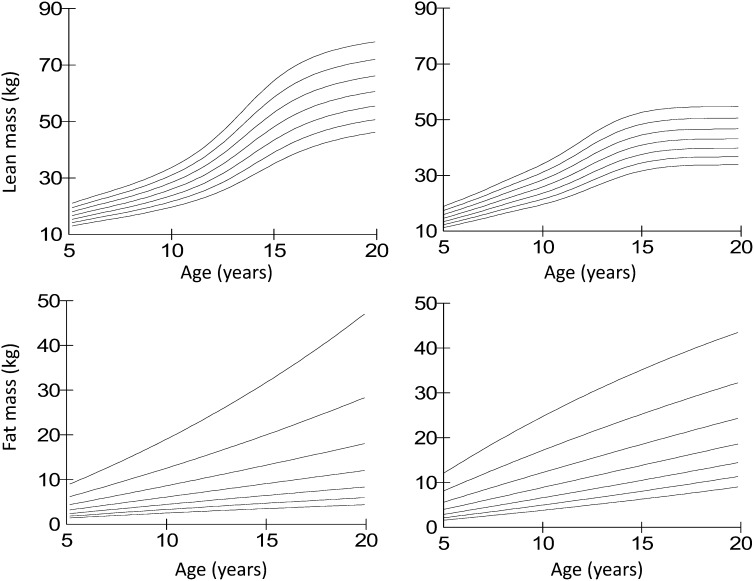
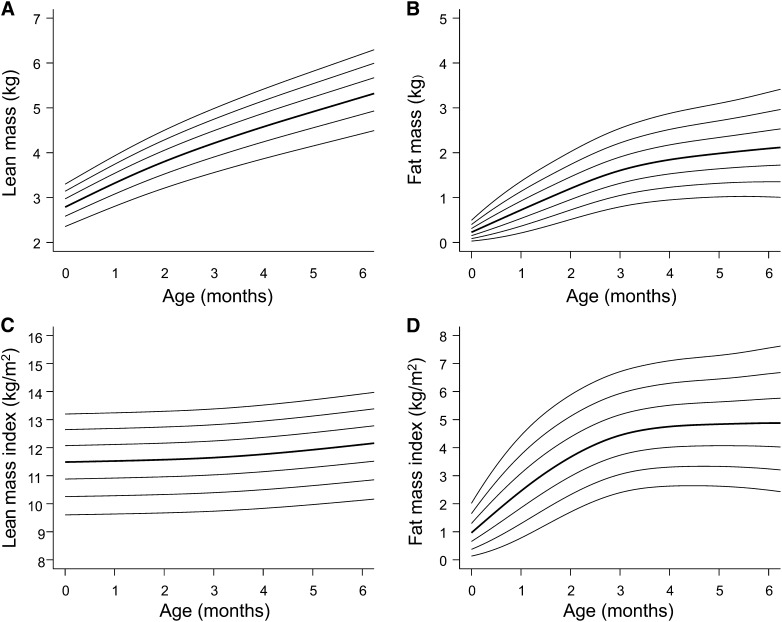
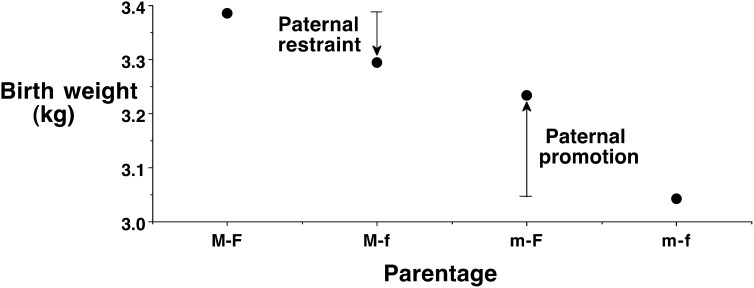
Growth charts for weight and height have provided the basis for assessment of children's nutritional status for over half a century, with charts for body mass index (BMI) introduced in the 1990s. However, BMI does not provide information on the proportions of fat and lean mass; and within the past decade, growth charts for children's body composition have been produced by using techniques such as skinfold thicknesses, body circumferences, bioelectrical impedance analysis (BIA), and dual-energy X-ray absorptiometry (DXA). For public health research, BIA and skinfold thicknesses show negligible average bias but have wider limits of agreement than specialized techniques. For patients, DXA is the best individual method, but multicomponent models remain ideal because they address perturbations in lean mass composition. Data can be expressed in age- and sex-specific SD scores, in some cases adjusting for height. Most such reference data derive from high-income countries, but techniques such as air-displacement plethysmography allow infant body composition growth charts to be developed in low- and middle-income settings, where the data may improve understanding of the effects of low birth weight, wasting, and stunting on body composition. Recent studies suggest that between-population variability in body composition may derive in part from genetic factors, suggesting a universal human body composition reference may not be viable. Body composition growth charts may be extended into adult life to evaluate changes in fat and lean mass through the entire life course. These reference data will improve the understanding of the association between growth, body composition, health, and disease.
© 2014 American Society for Nutrition.
Conflict of interest statement
Author disclosures: J. C. K. Wells, no conflicts of interest.
Figures
References
-
- Bogin B. Patterns of human growth. Cambridge (UK): Cambridge University Press; 1988.
-
- Cole TJ. The LMS method for constructing normalized growth standards. Eur J Clin Nutr. 1990;44:45–60 - PubMed
-
- Cole TJ, Green PJ. Smoothing reference centile curves: the LMS method and penalized likelihood. Stat Med. 1992;11:1305–19 - PubMed
MeSH terms
LinkOut - more resources
Full Text Sources
Other Literature Sources
Miscellaneous
