. 2014 May 15;10(5):e1004382.
doi: 10.1371/journal.pgen.1004382. eCollection 2014 May.

A HECT ubiquitin-protein ligase as a novel candidate gene for altered quinine and quinidine responses in Plasmodium falciparum

Affiliations

A HECT ubiquitin-protein ligase as a novel candidate gene for altered quinine and quinidine responses in Plasmodium falciparum

Cecilia P Sanchez et al. PLoS Genet. .

Abstract

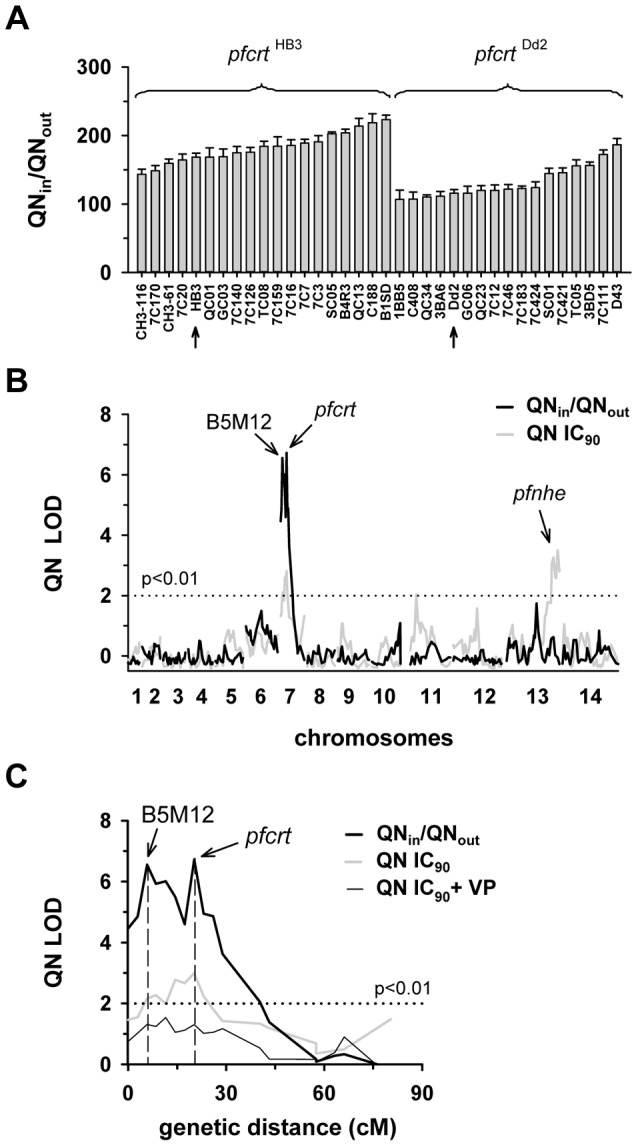
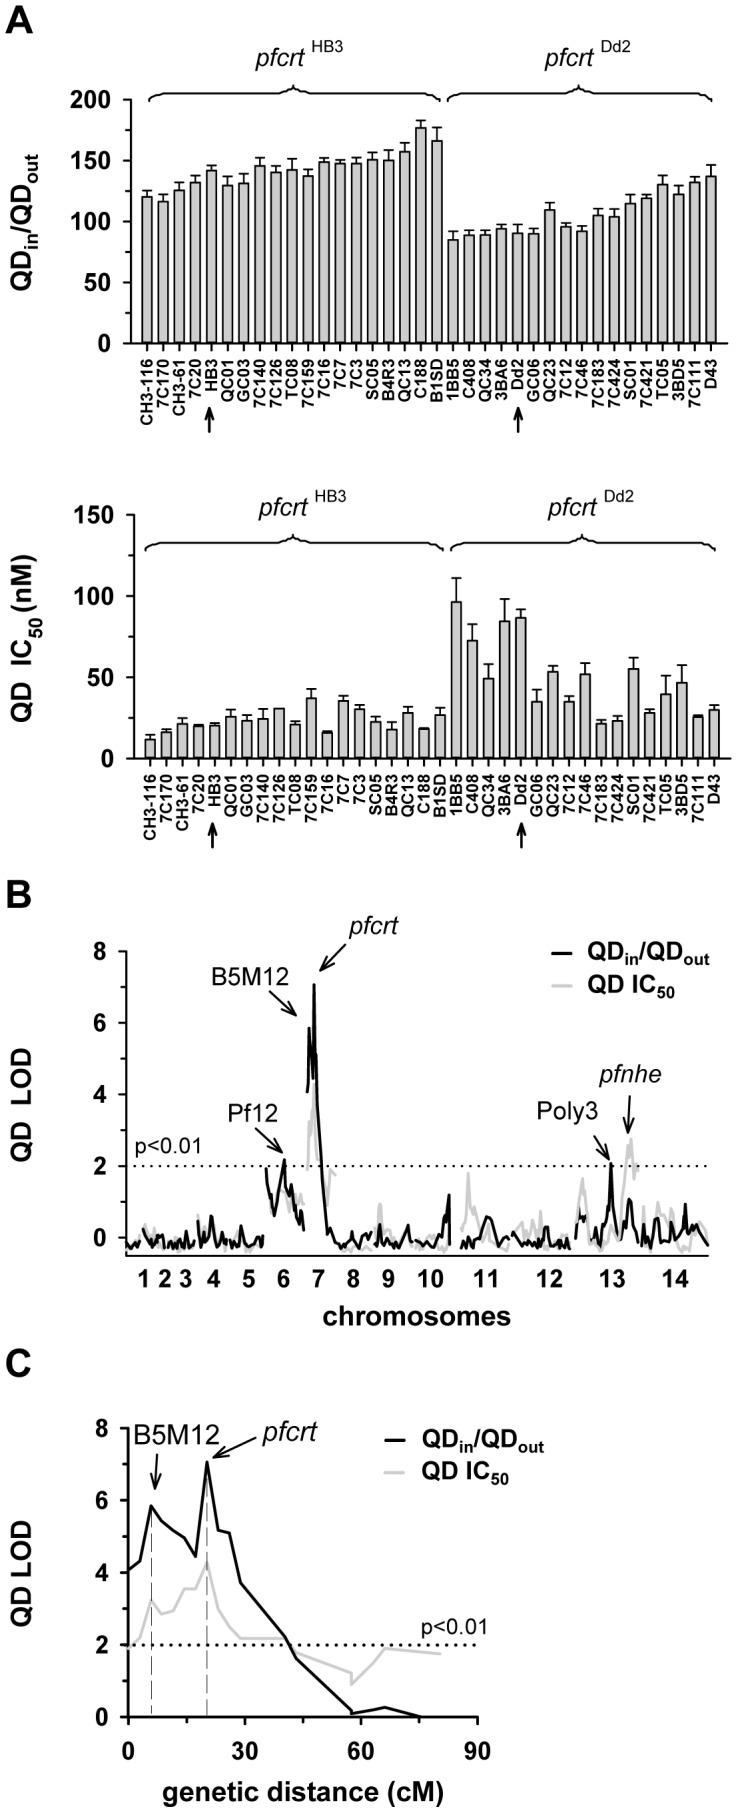
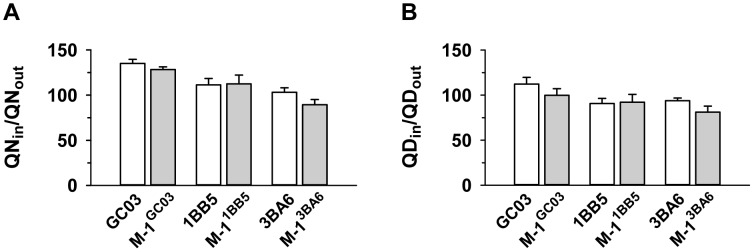
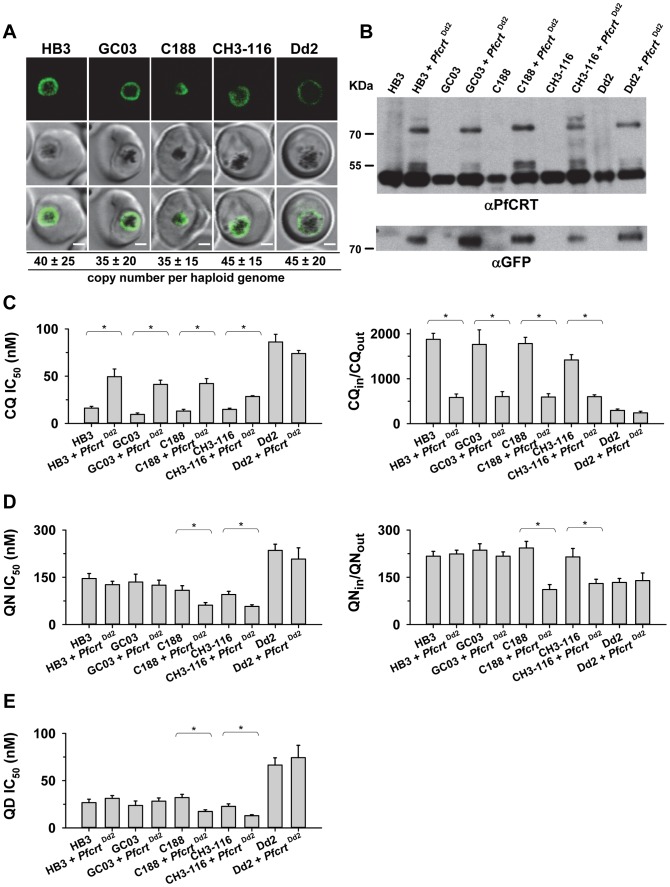
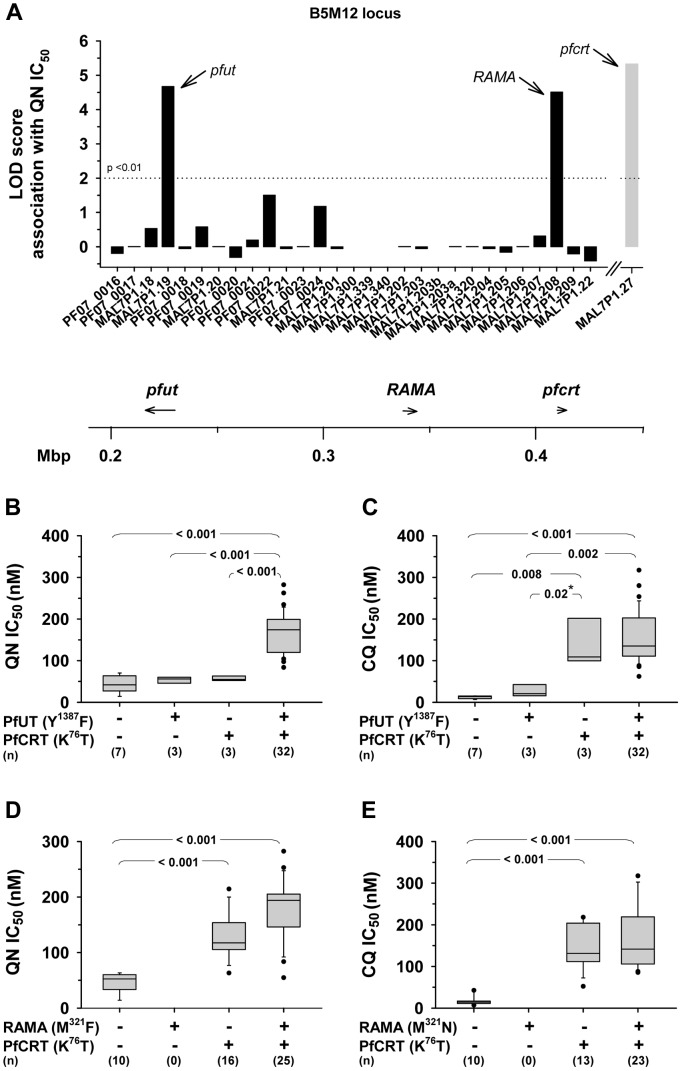
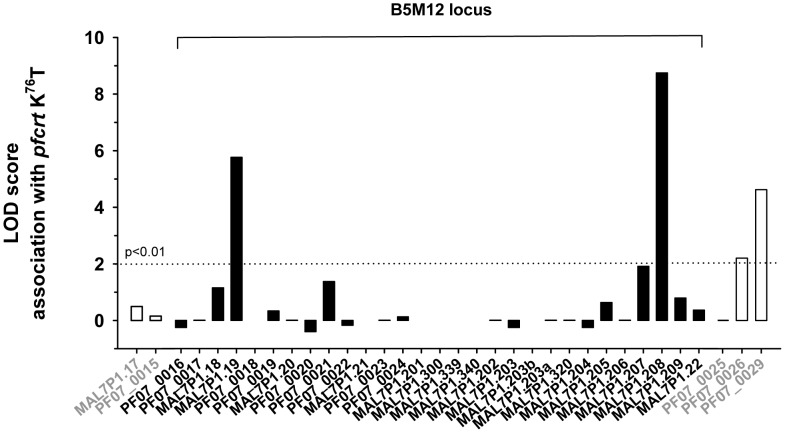
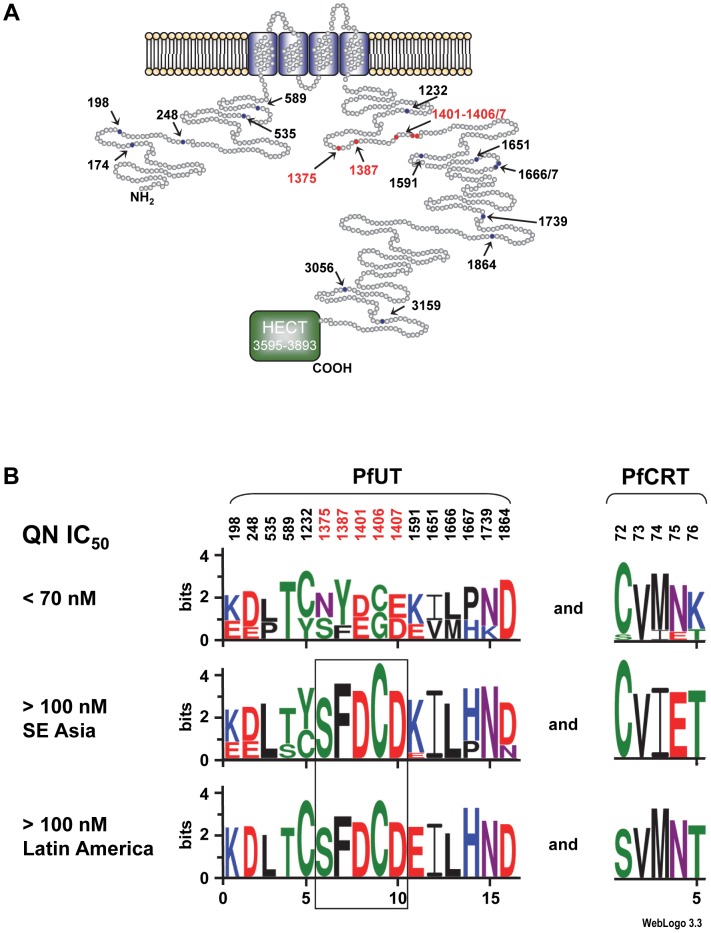
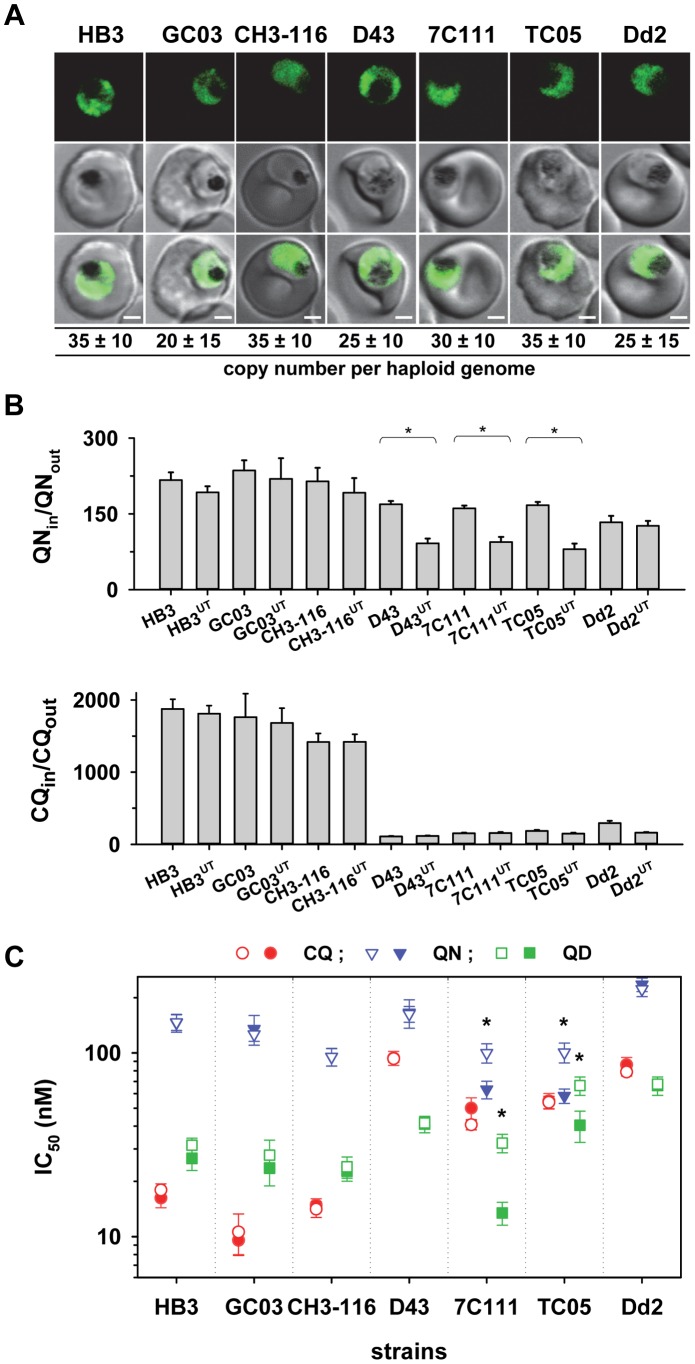
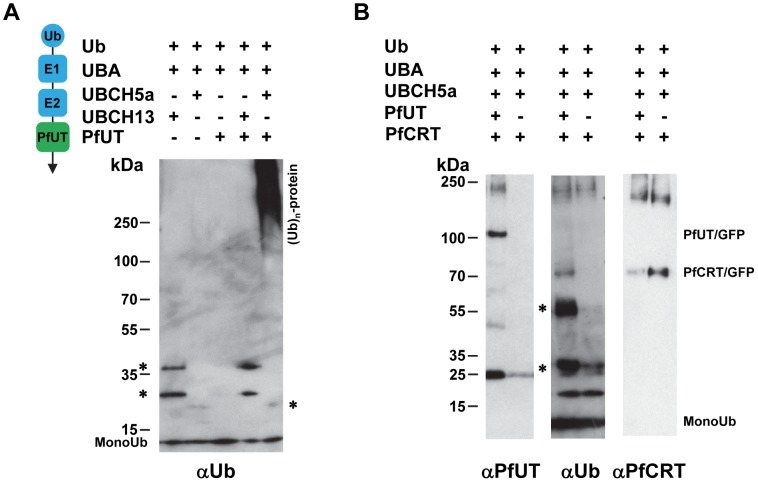
The emerging resistance to quinine jeopardizes the efficacy of a drug that has been used in the treatment of malaria for several centuries. To identify factors contributing to differential quinine responses in the human malaria parasite Plasmodium falciparum, we have conducted comparative quantitative trait locus analyses on the susceptibility to quinine and also its stereoisomer quinidine, and on the initial and steady-state intracellular drug accumulation levels in the F1 progeny of a genetic cross. These data, together with genetic screens of field isolates and laboratory strains associated differential quinine and quinidine responses with mutated pfcrt, a segment on chromosome 13, and a novel candidate gene, termed MAL7P1.19 (encoding a HECT ubiquitin ligase). Despite a strong likelihood of association, episomal transfections demonstrated a role for the HECT ubiquitin-protein ligase in quinine and quinidine sensitivity in only a subset of genetic backgrounds, and here the changes in IC50 values were moderate (approximately 2-fold). These data show that quinine responsiveness is a complex genetic trait with multiple alleles playing a role and that more experiments are needed to unravel the role of the contributing factors.


Conflict of interest statement

The authors have declared that no competing interests exist.

Figures

Figure 1
Figure 1. Linkage analyses on quinine responses in the HB3 x Dd2 cross.
A. The net intracellular quinine accumulation ratios (given as the ratio of the intracellular versus extracellular quinine concentration, QNin/QNout) were determined in the F1 progeny from the genetic cross between HB3 and Dd2 and in the two parental strains after 5 min of incubation (initial uptake phase). The names of the progeny and the parental stains are indicated. Progeny containing the wild-type pfcrt of HB3 and the polymorphic pfcrt of Dd2 are indicated. The means ± SEM of at least 8 biological replicates are shown. B. QTL analyses on the net intracellular quinine accumulation ratios (black line) and the quinine IC90 values (grey line) are shown. The logarithm of odds (LOD) scores from the primary scans are shown as a function of genome location. The pfcrt and B5M12 loci on chromosome 7 and the bifurcated peak on chromosome 13 are indicated. The dotted line represents the confidence line with P<0.01. C. Enlarged display of the bifurcated peak on chromosome 7. The LOD scores corresponding to i) the quinine accumulation data (thick black line), ii) the quinine IC90 values (grey line), and iii) the quinine IC90 values determined in the presence of 0.89 µM verapamil (thin black line) are shown. The quinine IC90 values in the presence and absence of verapamil were taken from Ferdig et al. 2004 . The analysis of the 25 min quinine accumulation data and the quinine IC50 values are shown in the supplementary Figure S2.
Figure 2
Figure 2. Linkage analyses on quinidine responses in the HB3 x Dd2 cross.
A. The quinidine IC50 values (upper panel) and the net intracellular quinidine accumulation ratios (QDin/QDout) (lower panel) were determined in the F1 progeny from the genetic cross between HB3 and Dd2 and in the two parental strains after 5 min of incubation (initial uptake phase). The means ± SEM of at least 8 biological replicates are shown. B. QTL analyses on the net intracellular quinine accumulation ratios (black line) and the quinine IC50 values (grey line) are shown. Relevant genetic markers are indicated. C. Enlarged display of the bifurcated peak on chromosome 7, with thick black line and grey line showing the LOD scores for the quinidine accumulation data and the quinidine IC50 values, respectively. The analysis of the 25 min quinidine accumulation data are shown in the supplementary Figure S3.
Figure 3
Figure 3. Effect of pfnhe on quinine and quinidine accumulation.
Quinine (A) and quinidine (B) accumulation ratios (at 5 min) in different pfnhe expression mutants and in the corresponding parental strains. The means ± SEM of at least 8 biological replicates are shown.
Figure 4
Figure 4. Functional association between the B5M12 locus and mutant PfCRT in conferring quinine and quinidine response variations.
A. Live cell images of the P. falciparum strains indicated expressing an episomal copy of the Dd2 form of pfcrt fused to the GFP coding sequence. Fluorescence is located at the digestive vacuolar membrane, consistent with previous reports . Bar, 2 µM. The copy number of the plasmid per haploid genome is indicated. The means ± SEM of at least 6 biological replicates are shown. The copy numbers are not statistically different in the transfectants. B. Western analysis using an antiserum specific to PfCRT. Total protein from 6×10⁶ parasites each were size-fractionated by SDS PAGE on a 4–12% gradient gel, transferred to a polyvinylidene difluoride membrane, and analyzed using an antiserum specific to PfCRT (αPfCRT, dilution 1∶1000; upper panel) and GFP (αGFP, dilution 1∶1000; lower panel). The molecular weight of the endogenous PfCRT is 48.7 kDa and that of the episomally expressed PfCRT/GFP fusion protein is 75.6 kDa. C. Chloroquine IC50 values (left panel) and accumulation ratios at the 20 min time point (right panel) in transfected parasite lines and the corresponding parental strains. D. Quinine IC50 values (left panel) and accumulation ratios at the 20 min time point (right panel). E. Quinidine IC50 values. The means ± SEM of at least 10 independent determinations are shown in parts D to E. *, P<0.01. The genetic backgrounds of the parasite lines with regard to the relevant chromosome 7 and 13 markers is compiled in Table 1.
Figure 5
Figure 5. Delineation of the B5M12 locus.
A. Linkage analysis on quinine IC50 values with polymorphic annotated genes in the B5M12 locus in 50 field isolates and laboratory strains. The LOD score of pfcrt (grey bar), which resides outside the B5M12 locus, is shown for comparison. Gaps indicate genes that were not included in the analysis. The confidence line is indicated. Arrows point towards pfut, RAMA and pfcrt. The location (according to the 3D7 reference sequence) and orientation of pfut, RAMA and pfcrt on chromosome 7 is indicated in the schematic drawing below. B and C. Parasites were grouped according to their haplotypes with regard to pfcrt and the HECT ubiquitin-protein ligase gene (pfut) and analyzed as a function of the quinine IC50 values (B) and the chloroquine IC50 values (C). D. and E. Parasites were grouped according to their haplotypes with regard to pfcrt and RAMA and analyzed as a function of the quinine IC50 values (D) and the chloroquine IC50 values (E). Statistical significance between different parasite groups is indicated. *, Fisher's LSD test, in all other cases one way ANOVA test. The quinine and chloroquine IC50 values were taken from Mu et al. (2003) .
Figure 6
Figure 6. Association of polymorphic genes within the B5M12 locus (black bars) and flanking regions (white bars) with mutant pfcrt as defined by the K76T replacement.
The confidence line is indicated.
Figure 7
Figure 7. Schematic representation of the HECT ubiquitin-protein ligase (PfUT).
A. Topological model of the HECT ubiquitin-protein ligase. The protein consists of 3893 amino acids and has a predicted molecular mass of 460,420 kDa. The protein has four putative transmembrane domains and a catalytic domain (HECT domain) that characterizes the protein as a member of the ubiquitin ligase family. Note that the predicted size of the HECT domain depends on the search engine used. The model shows the HECT domain as predicted by PFAM. Polymorphic residues analyzed in this study are indicated. Red highlights conserved polymorphisms. B. The 50 P. falciparum field isolates and laboratory strains depicted in supplementary Table S5 were grouped with regard to their quinine IC50 values. Parasites with IC50 values exceeding 100 nM were subsequently grouped according to their geographic origin. The sequence logos show the degree of conservation within polymorphic sites within PfUT and PfCRT. The height of each letter is proportional to the frequency of amino acids in each position. The quinine and chloroquine IC50 values were taken from Mu et al. (2003) . The number of strains included in each group is as follows: Latin America (n = 9), Southeast Asia (n = 23), and strains with IC50 values <70 nM (n = 13). The two African strains with IC50 values >100 nM for which sequence data on PFUT were available shared the conserved set of polymorphic amino acids (see supplementary Table S5). Two Africans stains could not be grouped due to incomplete sequence information regarding PfUT and one strain from Latin America that had a quinine IC50 value of 84 nM was also not included in the analysis.
Figure 8
Figure 8. HECT ubiquitin-protein ligase (PfUT) localizes to the ER/Golgi complex.
A. PfUT forms high molecular weight complexes under native conditions. Isolated purified trophozoites were extracted with increasing concentrations of Triton X-100. Extracted proteins were size fractionated using a native blue gel. PfUT was subsequently detected using a rabbit peptide antisera (1∶1000). At low concentrations of Triton X-100, high molecular weight species of >1 MDa were visible, whereas at high Triton X-100 concentrations a species corresponding to the predicted molecular weight of PfUT was detected (arrowhead). B. Membrane proteins extracted with Triton X-114 from purified and isolated trophozoites were size fractionated by SDS-PAGE and analyzed using a rabbit antisera specific to the N-terminal domain of PfUT (1∶1000). PfUT is detectable as a species of 460 kDa under denaturing and reducing conditions. Total membrane proteins from uninfected erythrocytes (RBC) were used as a control. C. Subcellular localization of PfUT. P. falciparum-infected erythrocytes at the trophozoite stage were fixed and analyzed by immunofluorescence assays using antisera to the ER marker BiP (rabbit, 1∶1000), the Golgi marker ERD2 (rat, 1∶500), and the N- (panels 1 and 5, rabbit, 1∶3000; panel 3, mouse, 1∶2000) and C-terminal domains of PfUT (panels 2 and 4, rabbit, 1∶3000). Panel 1 shows a late ring stage parasite, the other panels show trophozoites. GFP fluorescence was detected, by confocal fluorescence microscopy, in parasites expressing episomally a PfCRT/GFP fusion protein. The different antisera raised against PfUT showed comparable results. Bar, 2 µm. D. Subcellular localization of PfUT by immunoelectron microscopy. The upper panel shows a representative micrograph of a P. falciparum-infected erythrocyte preserved by high-pressure freezing and freeze-substitution, and immunolabelled with a rabbit antiserum specific to the N-terminal domain of PfUT (1∶100) coupled to 10 nm protein A colloidal gold. The lower panel shows the surface rendered view of the micrograph, with red dots representing gold grains. Insert: Magnification of boxed section in micrograph. Arrowheads point towards gold label. n, nucleus; fv, food vacuole. Scale bar in D and E, 500 nm. E. Quantification of immuno EM results. The distribution of gold grains was determined in 15 micrographs and analyzed according to their subcellular localization per µm2. Gold grains were significantly more present in areas of ER/Golgi complex (ER) than in other subcellular compartments, including the cytoplasm of the parasite (Pfcyt), the cytoplasm of the host cell (RBC), and non cellular background (BK) (P<0.001).
Figure 9
Figure 9. Overexpression of the HECT domain of PfUT confers quinine and quinidine response variations in appropriate genetic backgrounds.
A. Live cell images of the P. falciparum strains indicated expressing an episomal copy of the catalytic domain of PfUT fused to GFP. The fluorescence signal is located in the parasite's cytoplasm. Bar, 2 µM. The copy number of the plasmid per haploid genome is indicated. The means ± SEM of at least 6 biological replicates are shown. The copy numbers are not statistically different in the transfectants. B. Quinine (upper panel) and chloroquine (lower panel) accumulation ratios at the 20 min time point in the transfected parasite lines and the corresponding parental strains. The means ± SEM of at least 10 biological replicates are shown. *, P<0.001. C. Susceptibilities of the transfected parasite lines and the corresponding parental strains to different quinolines. The IC50 values to chloroquine (red), quinine (blue), and quinidine (green) were determined in parallel assays for each strain and are shown as the mean ± SEM of at least 8 biological replicates. The corresponding IC50 values for the transfectant (open symbol) and the respective parental strain (filled symbol) are plotted in the same line. Statistically different IC50 values between transfectant and parental strain are indicated by an asterisk (P<0.01). The relevant genetic markers of the strains are listed in Table 1.
Figure 10
Figure 10. Biochemical characterization of the PfUT HECT domain.
A. The PfUT HECT domain/GFP fusion protein catalyzes self polyubiquitination. The PfUT HECT domain/GFP fusion protein was isolated from the corresponding transfected Dd2 line and the catalytic activity of the PfUT HECT domain/GFP fusion protein was tested in an in vitro assay reconstituted with the components indicated. The left scheme indicates the origin of the components and their function. The human components ubiquitin (Ub), E1 activating enzyme (E1; UBA), and the E2 conjugating enzymes (E2; UBCH5a or UBCH13) are highlighted in blue. The PfUT HECT domain/GFP fusion protein (PfUT) is indicated in green. The reactions were examined by Western analysis using SDS PAGE on a 4 -12% gradient gel under non-reducing conditions and an antiserum specific to ubiquitin (αUb, dilution 1∶2000). The asterisks mark ubiquitin intermediate adducts generated by UBCH13 and UBCH5a. High molecular weight ubiquitinated products are indicated. A molecular weight marker is indicated in kDa. A representative example of at least three biological replicates is shown. The supplementary Figure S6A shows an independent biological replicate and supplementary Figure S6B shows absence of enzymatic activity when parasite purified GFP was used in the assay instead of the PfUT HECT domain/GFP fusion. B. The PfUT HECT domain/GFP fusion protein catalyzes ubiquitination of substrate proteins. In vitro ubiquitination assays were reconstituted using the components indicated, including a PfCRT/GFP fusion protein isolated from the corresponding transfected Dd2 line. The reactions were examined by Western analysis using SDS PAGE on a 4–12% gradient gel under non-reducing conditions and antisera specific to the PfUT HECT domain (αPfUT, dilution 1∶5000), ubiquitin (αUb, dilution 1∶2000), and PfCRT (αPfCRT, dilution 1∶1000). In addition to PfCRT/GFP, the immunoglobulin heavy (53 kDa plus ubiquitin) and light chains (25 kDa plus ubiquitin) (present in the reaction because the conditions required to elute PfCRT/GFP also eluted immunoglobulins from the column) were ubiqutinated and are indicated by asterisks.

Similar articles

Cited by

References

    1. World Health Organization (2012) World Malaria Report 2012. Geneva: World Health Organization.
    1. World Health Organization (2010) Guidelines for the treatment of malaria — 2nd edition. Geneva: World Health Organization.
    1. Pukrittayakamee S, Supanaranond W, Looareesuwan S, Vanijanonta S, White NJ (1994) Quinine in severe falciparum malaria: evidence of declining efficacy in Thailand. Trans R Soc Trop Med Hyg 88: 324–327. - PubMed
    1. Huttinger F, Satimai W, Wernsdorfer G, Wiedermann U, Congpuong K, et al. (2010) Sensitivity to artemisinin, mefloquine and quinine of Plasmodium falciparum in northwestern Thailand. Wien Klin Wochenschr 122 Suppl 352–56. - PubMed
    1. Chaijaroenkul W, Wisedpanichkij R, Na-Bangchang K (2010) Monitoring of in vitro susceptibilities and molecular markers of resistance of Plasmodium falciparum isolates from Thai-Myanmar border to chloroquine, quinine, mefloquine and artesunate. Acta Trop 113: 190–194. - PubMed

Publication types

MeSH terms

LinkOut - more resources