Meta-Analysis
. 2014 May 15;10(5):e1004383.
doi: 10.1371/journal.pgen.1004383. eCollection 2014 May.

Bayesian test for colocalisation between pairs of genetic association studies using summary statistics

Affiliations
Meta-Analysis

Bayesian test for colocalisation between pairs of genetic association studies using summary statistics

Claudia Giambartolomei et al. PLoS Genet. .

Abstract

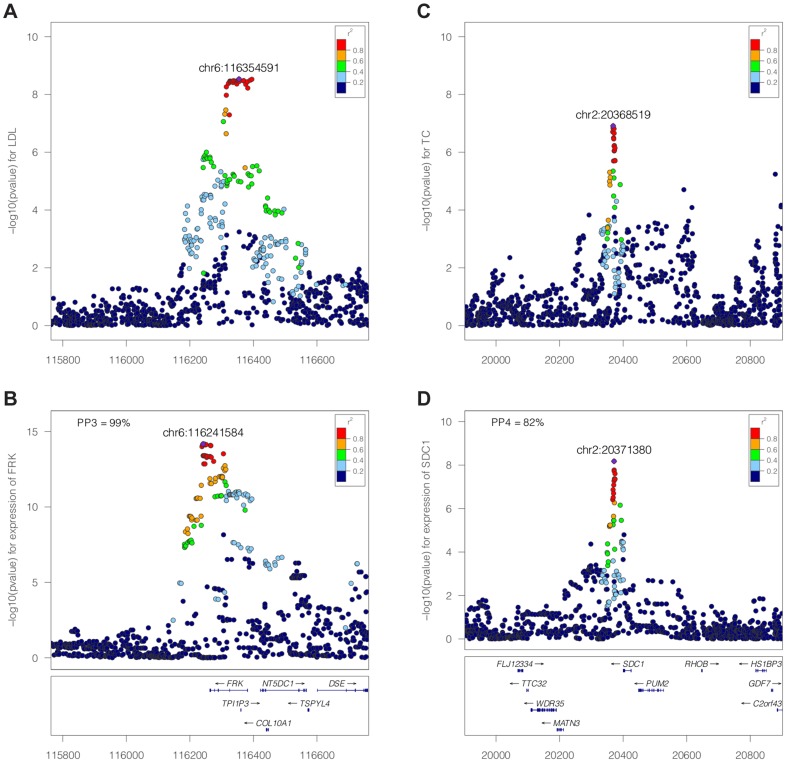
Genetic association studies, in particular the genome-wide association study (GWAS) design, have provided a wealth of novel insights into the aetiology of a wide range of human diseases and traits, in particular cardiovascular diseases and lipid biomarkers. The next challenge consists of understanding the molecular basis of these associations. The integration of multiple association datasets, including gene expression datasets, can contribute to this goal. We have developed a novel statistical methodology to assess whether two association signals are consistent with a shared causal variant. An application is the integration of disease scans with expression quantitative trait locus (eQTL) studies, but any pair of GWAS datasets can be integrated in this framework. We demonstrate the value of the approach by re-analysing a gene expression dataset in 966 liver samples with a published meta-analysis of lipid traits including >100,000 individuals of European ancestry. Combining all lipid biomarkers, our re-analysis supported 26 out of 38 reported colocalisation results with eQTLs and identified 14 new colocalisation results, hence highlighting the value of a formal statistical test. In three cases of reported eQTL-lipid pairs (SYPL2, IFT172, TBKBP1) for which our analysis suggests that the eQTL pattern is not consistent with the lipid association, we identify alternative colocalisation results with SORT1, GCKR, and KPNB1, indicating that these genes are more likely to be causal in these genomic intervals. A key feature of the method is the ability to derive the output statistics from single SNP summary statistics, hence making it possible to perform systematic meta-analysis type comparisons across multiple GWAS datasets (implemented online at http://coloc.cs.ucl.ac.uk/coloc/). Our methodology provides information about candidate causal genes in associated intervals and has direct implications for the understanding of complex diseases as well as the design of drugs to target disease pathways.


Conflict of interest statement

The authors have declared that no competing interests exist.

Figures

Figure 1
Figure 1. Example of one configuration under different hypotheses.
A configuration is represented by one binary vector for each trait of (0,1) values of length n = 8, the number of shared variants in a region. The value of 1 means that the variant is causally involved in disease, 0 that it is not. The first plot shows the case where only one dataset shows an association. The second plot shows that the causal SNP is different for the biomarker dataset compared to the expression dataset. The third plot shows the configuration where the single causal variant is the fourth one.
Figure 2
Figure 2. Illustration of the colocalisation results.
Negative [SPACE] (A–B, FRK gene and LDL, PP3 >90%) and positive (C–D, SDC1 gene and total cholesterol, PP4 >80%) colocalisation results. −log10(p) association p-values for biomarker (top, A and C) and −log10(p) association p-values for expression (bottom, B and D) at the FRK (A, B) and SDC1 locus (C, D), 1Mb range.
Figure 3
Figure 3. Simulation analysis with a shared causal variant between two studies.
The two datasets used are one eQTL (sample size 966 samples, 10% of the variance explained by the variant) and one biomarker (such as LDL). The variance explained by the biomarker is colour coded and the x-axis shows the sample size of the biomarker study. The y axis shows the median, 10% and 90% quantile of the distribution of PP4 values (which supports a shared common variant).
Figure 4
Figure 4. Simulation analysis with a shared causal variant between two studies.
The two datasets used are one eQTL (sample size 966 samples) and one biomarker (sample size of 4,000 samples). The variance explained by the biomarker and the expression is the same and is colour coded. The x-axis shows the estimated PP4 for 1,000 simulations using data imputed from metaboChip Illumina array. The y-axis uses the same dataset restricted to variants present on the Illumina 660W genotyping array to assess the impact of a lower variant density. A. The causal variant is included in the Illumina 660W panel. B. The causal SNP not included in Illumina 660W panel.
Figure 5
Figure 5. Summary of proportional and Bayesian colocalisation analysis of simulated data.
Each plot shows a different scenario, the total number of causal variants in a region is indicated by number of circles in the plot titles with causal variants affecting both traits, the eQTL trait only, or the biomarker trait only, indicated by full circles, top-shaded circles and bottom-shaded circles respectively. In the top row the causal variant is typed or imputed, whereas only tag variants are typed/imputed in the bottom row. For proportional testing (under the BMA approach), we show the proportion of simulations with posterior predictive p-value <0.05 (black horizontal line) while for our Bayesian analysis we plot the proportion of simulations with the posterior probability (PP3 or PP4) of the indicated hypothesis >0.9. Error bars show 95% confidence intervals (estimated based on an average of 1,000 simulations per scenario). In all cases, for the eQTL sample size is 1,000; genetic variants explain a total of 10% of eQTL variance; for the biomarker trait, the sample size is 10,000.
Figure 6
Figure 6. LDL association and eQTL association plots at the SYPL2 locus.
The x-axis shows the physical position on the chromosome (Mb) A: -log10(p) association p-values for LDL. The p-values are from the Teslovich et al published meta-analysis of >100,000 individuals. B: −log10(p) association p-values for SYPL2 expression in 966 liver samples. C: −log10(p) association p-values for SYPL2 expression conditional on the top eQTL associated SNP at this locus (rs2359653).

References

    1. Feero WG, Guttmacher AE, Manolio TA (2010) Genomewide association studies and assessment of the risk of disease. New England Journal of Medicine 363: 166–176. - PubMed
    1. Nica AC, Dermitzakis ET (2008) Using gene expression to investigate the genetic basis of complex disorders. Human molecular genetics 17: R129–R134. - PMC - PubMed
    1. Pickrell JK, Marioni JC, Pai AA, Degner JF, Engelhardt BE, et al. (2010) Understanding mechanisms underlying human gene expression variation with rna sequencing. Nature 464: 768–772. - PMC - PubMed
    1. Cookson W, Liang L, Abecasis G, Moffatt M, Lathrop M (2009) Mapping complex disease traits with global gene expression. Nature Reviews Genetics 10: 184–194. - PMC - PubMed
    1. Nica AC, Montgomery SB, Dimas AS, Stranger BE, Beazley C, et al. (2010) Candidate causal regulatory effects by integration of expression qtls with complex trait genetic associations. PLoS genetics 6: e1000895. - PMC - PubMed

Publication types