Transcriptome profiling of the theca interna in transition from small to large antral ovarian follicles
- PMID: 24830430
- PMCID: PMC4022581
- DOI: 10.1371/journal.pone.0097489
Transcriptome profiling of the theca interna in transition from small to large antral ovarian follicles
Abstract
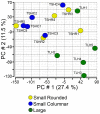
The theca interna layer of the ovarian follicle forms during the antral stage of follicle development and lies adjacent to and directly outside the follicular basal lamina. It supplies androgens and communicates with the granulosa cells and the oocyte by extracellular signaling. To better understand developmental changes in the theca interna, we undertook transcriptome profiling of the theca interna from small (3-5 mm, n = 10) and large (9-12 mm, n = 5) healthy antral bovine follicles, representing a calculated >7-fold increase in the amount of thecal tissue. Principal Component Analysis and hierarchical classification of the signal intensity plots for the arrays showed no clustering of the theca interna samples into groups depending on follicle size or subcategories of small follicles. From the over 23,000 probe sets analysed, only 76 were differentially expressed between large and small healthy follicles. Some of the differentially expressed genes were associated with processes such as myoblast differentiation, protein ubiquitination, nitric oxide and transforming growth factor β signaling. The most significant pathway affected from our analyses was found to be Wnt signaling, which was suppressed in large follicles via down-regulation of WNT2B and up-regulation of the inhibitor FRZB. These changes in the transcriptional profile could have been due to changes in cellular function or alternatively since the theca interna is composed of a number of different cell types it could have been due to any systematic change in the volume density of any particular cell type. However, our study suggests that the transcriptional profile of the theca interna is relatively stable during antral follicle development unlike that of granulosa cells observed previously. Thus both the cellular composition and cellular behavior of the theca interna and its contribution to follicular development appear to be relatively constant throughout the follicle growth phase examined.
Conflict of interest statement
Figures


Similar articles
-
Transcriptome profiling of the theca interna from bovine ovarian follicles during atresia.PLoS One. 2014 Jun 23;9(6):e99706. doi: 10.1371/journal.pone.0099706. eCollection 2014. PLoS One. 2014. PMID: 24956388 Free PMC article.
-
Transcriptome comparisons identify new cell markers for theca interna and granulosa cells from small and large antral ovarian follicles.PLoS One. 2015 Mar 16;10(3):e0119800. doi: 10.1371/journal.pone.0119800. eCollection 2015. PLoS One. 2015. PMID: 25775029 Free PMC article.
-
Transcriptome profiling of granulosa cells from bovine ovarian follicles during atresia.BMC Genomics. 2014 Jan 18;15:40. doi: 10.1186/1471-2164-15-40. BMC Genomics. 2014. PMID: 24438529 Free PMC article.
-
Local roles of TGF-beta superfamily members in the control of ovarian follicle development.Anim Reprod Sci. 2003 Oct 15;78(3-4):165-83. doi: 10.1016/s0378-4320(03)00089-7. Anim Reprod Sci. 2003. PMID: 12818643 Review.
-
Theca: the forgotten cell of the ovarian follicle.Reproduction. 2010 Oct;140(4):489-504. doi: 10.1530/REP-10-0094. Epub 2010 Jul 13. Reproduction. 2010. PMID: 20628033 Review.
Cited by
-
Transcriptome Sequencing-Based Mining of Genes Associated With Pubertal Initiation in Dolang Sheep.Front Genet. 2022 Mar 3;13:818810. doi: 10.3389/fgene.2022.818810. eCollection 2022. Front Genet. 2022. PMID: 35309120 Free PMC article.
-
Transcriptomal profiling of bovine ovarian granulosa and theca interna cells in primary culture in comparison with their in vivo counterparts.PLoS One. 2017 Mar 10;12(3):e0173391. doi: 10.1371/journal.pone.0173391. eCollection 2017. PLoS One. 2017. PMID: 28282394 Free PMC article.
-
MALDI-TOF Mass Spectrometry Revealed Significant Lipid Variations in Follicular Fluid and Somatic Follicular Cells but Not in Enclosed Oocytes between the Large Dominant and Small Subordinate Follicles in Bovine Ovary.Int J Mol Sci. 2020 Sep 11;21(18):6661. doi: 10.3390/ijms21186661. Int J Mol Sci. 2020. PMID: 32932995 Free PMC article.
-
Transcriptome Analysis During Follicle Development in Turkey Hens With Low and High Egg Production.Front Genet. 2021 Mar 18;12:619196. doi: 10.3389/fgene.2021.619196. eCollection 2021. Front Genet. 2021. PMID: 33815464 Free PMC article.
-
Effects of Adiponectin Including Reduction of Androstenedione Secretion and Ovarian Oxidative Stress Parameters In Vivo.PLoS One. 2016 May 9;11(5):e0154453. doi: 10.1371/journal.pone.0154453. eCollection 2016. PLoS One. 2016. PMID: 27158926 Free PMC article.
References
-
- Young JM, McNeilly AS (2010) Theca: the forgotten cell of the ovarian follicle. Reproduction 140: 489–504. - PubMed
-
- Tajima K, Orisaka M, Mori T, Kotsuji F (2007) Ovarian theca cells in follicular function. Reprod Biomed Online 15: 591–609. - PubMed
-
- Orisaka M, Tajima K, Mizutani T, Miyamoto K, Tsang BK, et al. (2006) Granulosa cells promote differentiation of cortical stromal cells into theca cells in the bovine ovary. Biol Reprod 75: 734–740. - PubMed
Publication types
MeSH terms
Substances
LinkOut - more resources
Full Text Sources
Other Literature Sources
Molecular Biology Databases

