

Review
doi: 10.1021/cr400713r.
Epub 2014 May 15.
Pathological unfoldomics of uncontrolled chaos: intrinsically disordered proteins and human diseases
Affiliations
- PMID: 24830552
- PMCID: PMC4100540
- DOI: 10.1021/cr400713r
Item in Clipboard
Review
Pathological unfoldomics of uncontrolled chaos: intrinsically disordered proteins and human diseases
Chem Rev.
.
No abstract available
Figures
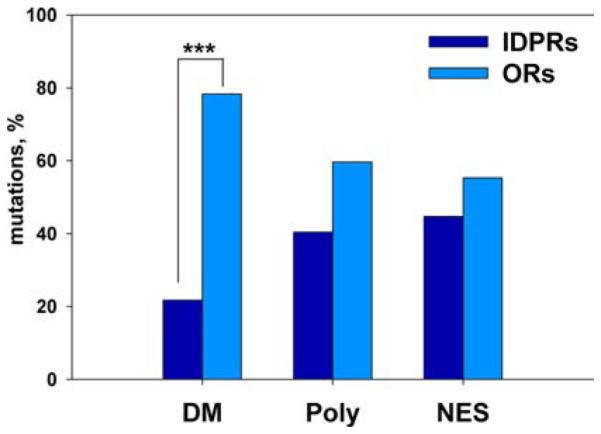
Distribution of disease mutations (DM) between predicted ordered regions (OR) and intrinsically disordered protein regions (IDPR) of proteins. Analysis of annotated DMs from the UniProt database shows that they are enriched in ordered regions of proteins compared to polymorphisms (Poly) or neutral evolutionary substitutions (NES). Data from ref 93 were used to create this figure.
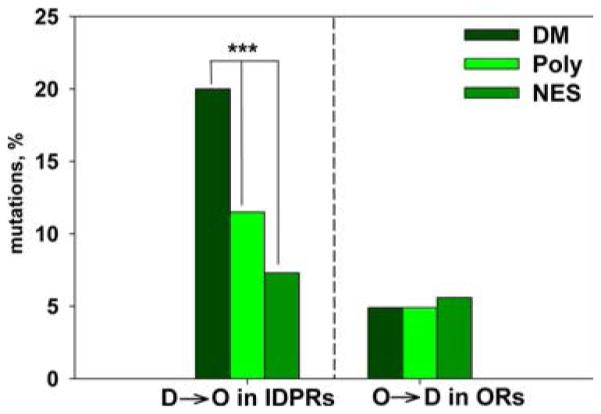
Conformational effects of disease mutations. Shown are the percentages of predicted order transitions for different classes of mutation in intrinsically disordered regions (IDPRs, left) and ordered regions (ORs, right) of proteins. A significantly greater percentage of disease mutations (DM) leads to a disorder-to-order (D → O) transition compared to polymorphisms (Poly) or neutral evolutionary substitutions (NES). For mutations in ordered protein regions, there is no significant difference in the percentage of order-to-disorder (O → D) transitions for the three mutant classes. Data from ref 93 were used to create this figure.
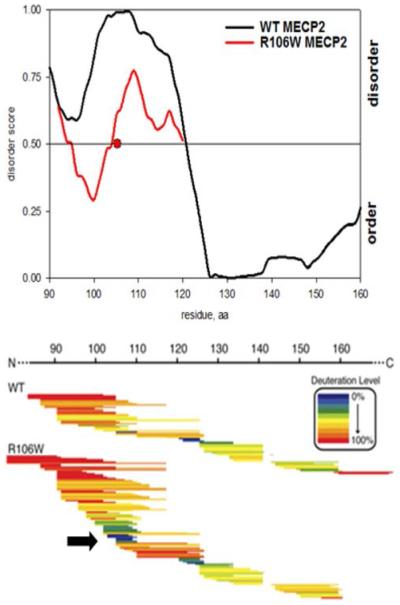
Effect of R106W mutation on the conformational state of MECP2. (Top) PONDR VL-XT disorder predictions for the residue 90–160 region of the wild type (WT) and R106W mutant of MECP2. The mutation (red circle) decreases the disorder score of the 95–125 MECP2 region. (Bottom) H/D exchange profiles of the WT and R106W mutant of MECP2. The black arrow points to a more slowly exchanging region at the mutation site. Adapted with permission from ref 110. Copyright 2011 American Society for Biochemistry and Molecular Biology.
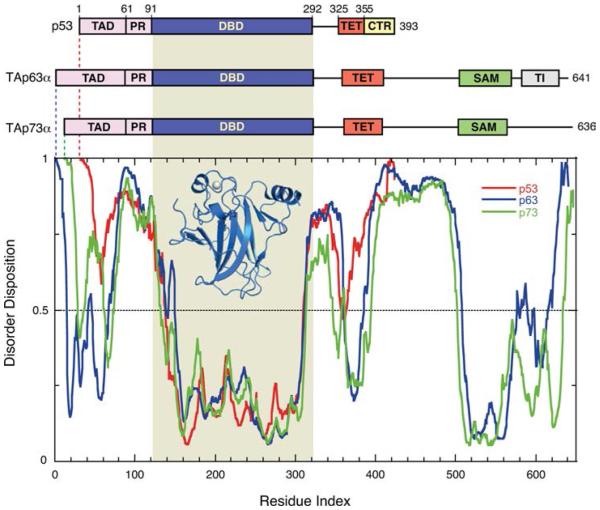
Schematic domain organization of p53 family members and disorder prediction. p53 consists of a natively unfolded N-terminal transactivation domain (TAD), a proline-rich region (PR), a DNA-binding domain (DBD), a flexible linker region, a tetramerization domain (TET), and the intrinsically disordered C-terminal regulatory domain (CTR). The paralogues p63 and p73 have a similar domain organization but feature an extended C-terminal region, including a structured sterile α motif (SAM) domain and in the case of p63 a transactivation inhibitory region (TI). The plot shows the disorder prediction for the three proteins by PONDR-FIT. The disorder prediction curves for the three proteins are aligned on the basis of the position of DBDs, which show the highest sequence conservation. A value above 0.5 indicates structural disorder. The structure of the human p53 DBD (PDB entry 2XWR) is shown as a blue ribbon diagram, and the bound zinc ion is highlighted as a gray sphere.
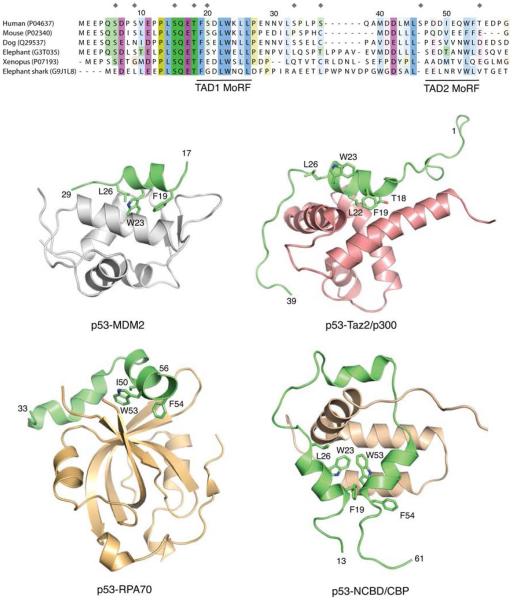
Molecular recognition features in p53 transactivation domain (TAD). Sequence alignment of p53 TAD from different vertebrate species shows the location of MoRFs in TAD1 and TAD2. UniProt accession numbers are given in parentheses. Gray diamond shapes indicate phosphorylation sites in the human protein. Key interacting hydrophobic residues in TAD1 are highly conserved. The sequence alignment was generated by use of MUSCLE and JALVIEW. The two MoRFs undergo disorder-to-order transition and form an amphipathic α-helix upon binding to various target proteins in the cell cycle. Shown are complexes with MDM2 (PDB entry 1YCR), Taz2 domain of p300 (PDB entry 2K8F), RPA70 subunit of replication protein A (PDB entry 2B3G), and nuclear coactivator binding domain (NCBD) of CBP (PDB entry 2L14). Structures of the complexes are shown as cartoon representations. The p53 segment in each structure is highlighted in green, and key contact residues are shown as stick models. Structural representations in this and following figures were generated by use of PyMOL (www.pymol.org ).
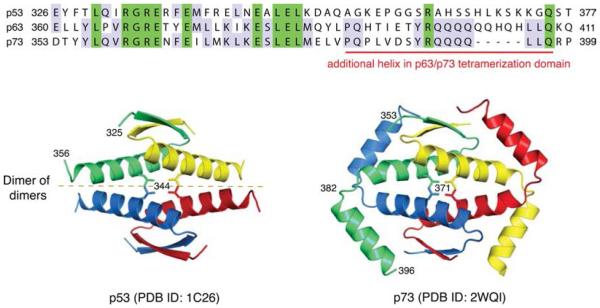
Structures of p53 family tetramerization domains. The sequence alignment shows the oligomerization domain regions of human p53, p63, and p73. Identical residues in all three sequences are highlighted in green, while residues that are identical in only two members are highlighted in light blue. p63 and p73 form an extended oligomerization domain and require a second helix for formation of stable tetramers. Crystal structures of p53 (PDB entry 1C26) and p73 (PDB entry 2WQI) tetramers show the assembly of tetramers as dimers of dimers with highly intertwined monomers (shown in different colors).,
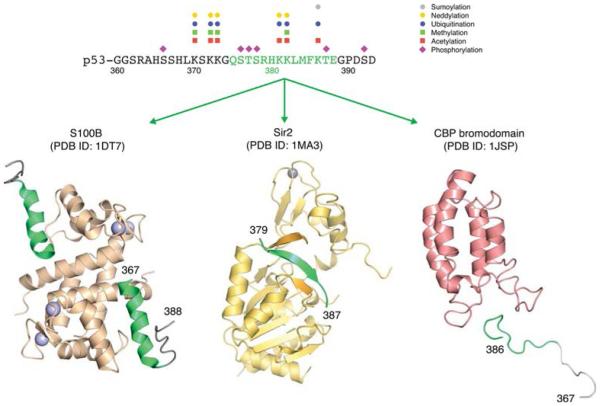
Chameleon sequence in the C-terminal regulatory domain of p53. A short segment in the C-terminal domain of p53 (green sequence motif) adopts different secondary structures, depending on its interaction partner, as shown for the structures in complex with calcium-loaded S110B (PDB entry 1DT7), deacetylase Sir2 (PDB entry 1MA3), and bromodomain of transcriptional coactivator CBP (PDB entry 1JSP). Data from refs 124 and 125 were used to show sites of PTMs.
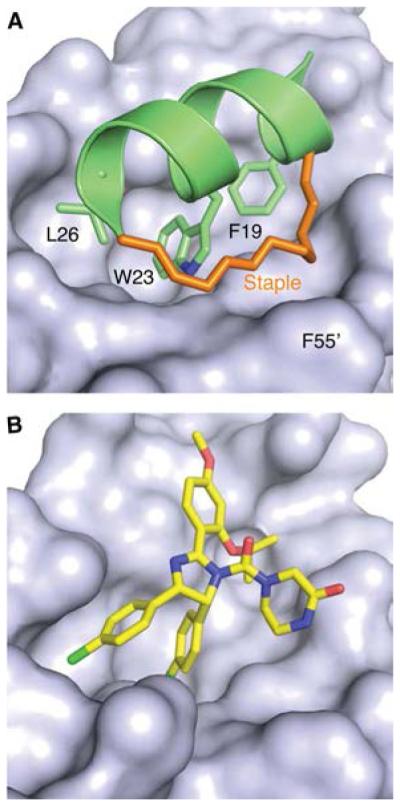
Targeting the p53–MDM2 interaction in cancer therapy. (A) Crystal structure of a p53-derived stapled peptide bound to the N-terminal domain of MDM2 (PDB entry 3V3B). The molecular surface of MDM2 is shown in gray and the p53 helix in green, with the three key interacting side chains of the p53 helix (Phe19, Trp23, and Leu26) highlighted as stick models. The hydrocarbon staple (orange sticks) not only increases the helix propensity of the peptide but also forms specific interactions with Phe55 at the rim of the p53 binding pocket of MDM2. (B) Crystal structure of MDM2 in complex with the inhibitor nutlin 3a (PDB entry 4HG7). The orientation is the same as in panel A. The rigid cis-imidazoline scaffold mimics key hydrophobic interactions made by the p53 helix. Two chlorophenyl groups are projected into the Trp23 and Leu26 subpockets, and a 2-propoxy group occupies the Phe19 subpocket.
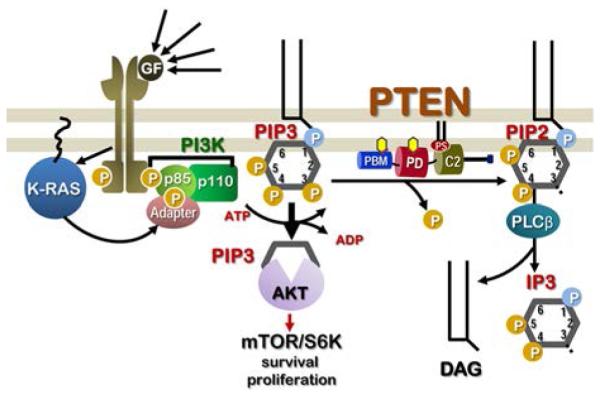
Role of PTEN in PI3K/AKT/mTOR signaling and cell proliferation following growth factor binding to its receptor. Growth factors such as epidermal growth factor (EGF) and insulin-like growth factor (IGF) bind to receptor tyrosine kinases (RTKs). Ligand-induced receptor dimerization and subsequent autophosphorylation of distinct tyrosine residues creates docking sites for various membrane targets via distinct adaptor molecules. Depicted here is the lipid kinase PI3K (phosphoinositide 3-kinase), consisting of regulatory subunit p85 and catalytic subunit p110, that phosphorylates PIP2 to generate the second messenger PIP3. Increase in cellular PIP3 levels results in the recruitment and activation of protein kinase AKT, thus initiating diverse cellular pathways leading to increase in proliferation, migration, gene transcription, cell cycle progression, and cell survival and changes in cell metabolism. For brevity, only the mTOR/S6K components of the pathway are shown here. Active small GTPase K-Ras also acts on PI3K and activates the mTOR pathway. Hyperactivation of the mTOR pathway causes aberrant cell proliferation and cancer. Therefore, PTEN, a lipid phosphatase, continuously removes a 3′-position phosphate group (P) in the inositol ring and converts PIP3 to PIP2. Decrease in PIP3 levels keeps the signaling via the PI3K/AKT/mTOR pathway in check. Later, PIP2 is hydrolyzed by phospholipase Cb (PLCb) to diacylglycerol (DAG) and inositol triphosphate (IP3); both molecules are involved in distinct calcium-dependent signaling events. Thus, since PTEN plays a central role in cell physiology and growth by regulating a myriad of downstream signaling events, understanding PTEN structure and its correlation to function is critical to modulating PTEN activity via targeted molecular therapies.
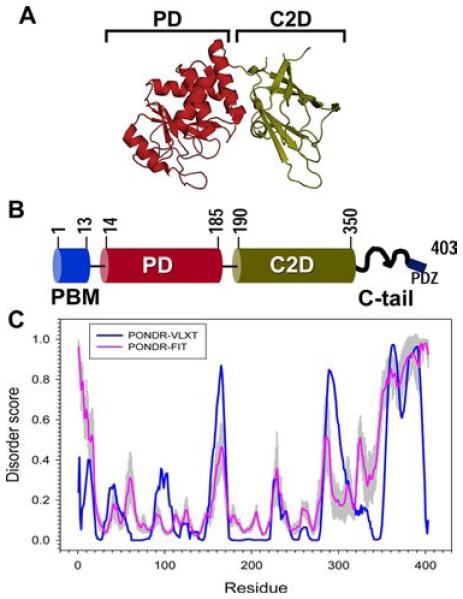
Domain organization of PTEN and disorder prediction. PTEN consists of four domains: PIP2 binding module (PBM), phosphatase domain (PD), C2 domain (C2D), and C-terminal tail (C-tail). Adapted from ref 37 under the Creative Commons Attribution-Non Commercial-ShareAlike 3.0 license. Copyright 2013 Nature Publishing Group. (A) PTEN crystal structure (PDB entry 1D5R) consists of only the PD and C2 domains. The structures of the N-terminal PBM and C-tail are largely unknown. (B) Functional domains in the PTEN protein. The PTEN protein consists of four functional domains: PBM (residues 1–13), which helps it anchor to the PIP2 residues in the membrane (its site of enzymatic activity); catalytic domain PD (residues 14–185), which has dual lipid and protein phosphatase activity; C2 domain (residues 190–350), primarily consisting of positively charged residues to help PTEN anchor to the membrane; and C-tail region (residues 351–403), which regulates PTEN function, membrane association, and stability through a series of phosphorylation events. A PDZ binding motif is part of the C-tail and helps PTEN interact with a multitude of PDZ-domain containing proteins. (C) Disorder prediction for PTEN. PONDR-VLXT and PONDR-FIT predictors were used to determine disordered regions in the PTEN protein. A value above 0.5 indicates structural disorder. The major disordered stretches in the PTEN protein consist of the CBR3 loop in the C2 domain (residues 286–309) and the C-tail (residues 351–403).
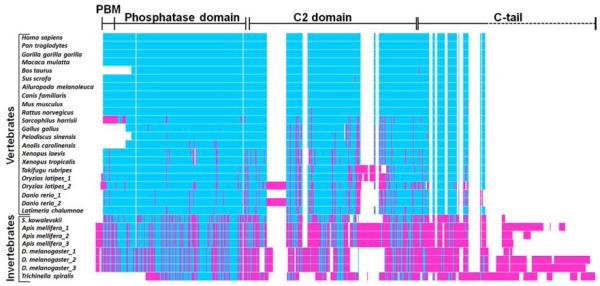
Evolutionary conservation of the PTEN IDPR. Sequence alignment for PTEN proteins from different species reveals that the disordered PTEN C-tail is conserved only in vertebrates. This points to the recent emergence of the functional implications of the C-tail in PTEN function in evolutionary history. Adapted with permission from ref 37. Copyright 2013 Nature Publishing Group.
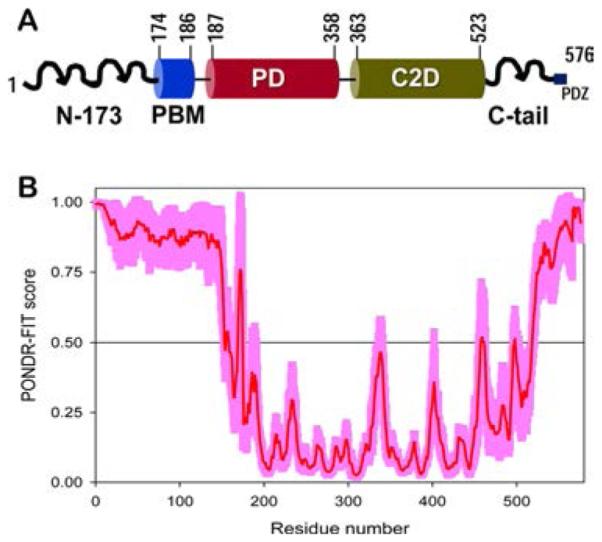
Intrinsic disorder and PTEN Long. (A) Diagrammatic representation of PTEN Long, a translational variant of PTEN that contains an extra 173 amino acids at its N-terminus (N-173). The peculiarity of PTEN Long is that it can be secreted from and taken up into cells at distant locations in the body. This secretory property of PTEN Long is conferred by critical polyalanine and polyarginine stretches in the N-173 region. (B) Disorder prediction for PTEN Long. PONDR-FIT was used to make disorder predictions for the PTEN Long protein. The additional N-173 amino acids in this PTEN translational variant are largely disordered. Reprinted with permission from ref 241. Copyright 2013 Royal Society of Chemistry.
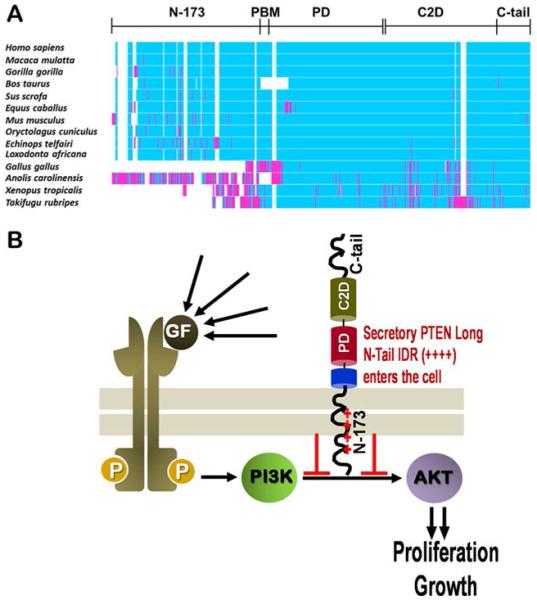
Sequence analysis and clinical implications of PTEN Long. (A) Sequence analysis. Alignments for the PTEN Long protein reveal the emergence of the additional N-173 region in higher terrestrial vertebrates. (B) Therapeutic relevance. Given the ability of PTEN Long to be taken up into cells, recombinant forms of the PTEN Long protein represent a novel chemotherapeutic modality. Recombinant PTEN Long may be taken up into cells where it can then abrogate proliferative PI3K/AKT/mTOR signaling to arrest tumor growth. Reprinted with permission from ref 241. Copyright 2013 Royal Society of Chemistry.
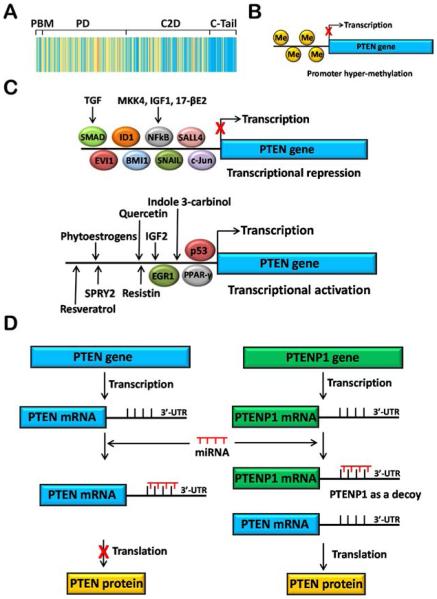
Genomic mechanisms of PTEN regulation. (A) Mutations. PTEN mutations are seen in several diseases like Cowden disease, hamartoma syndrome, and cancers. Mutations are found all along the length of the PTEN gene with the exception of exon 9, which codes for the disordered C-tail region. Mutational hotspots are indicated in shades of yellow, while areas with fewer observed mutations are indicated in blue. Data are taken from ref 379. (B) Epigenetic regulation. PTEN promoter methylation is frequently observed in cancers, resulting in suppression of its transcription. (C) Transcriptional regulation of PTEN. Several transcription factors, ligands, and dietary compounds modulate (increase or decrease) PTEN transcription. (D) Regulation by noncoding RNAs. Several miRNAs bind to the 3′-untranslated region (UTR) of the PTEN mRNA, thereby preventing translation of the mRNA into PTEN protein. PTENP1, a PTEN pseudogene, shares homology with the PTEN gene. The PTENP1 mRNA acts as a pseudosubstrate for the miRNAs and sequesters them, thereby allowing production of the PTEN protein.
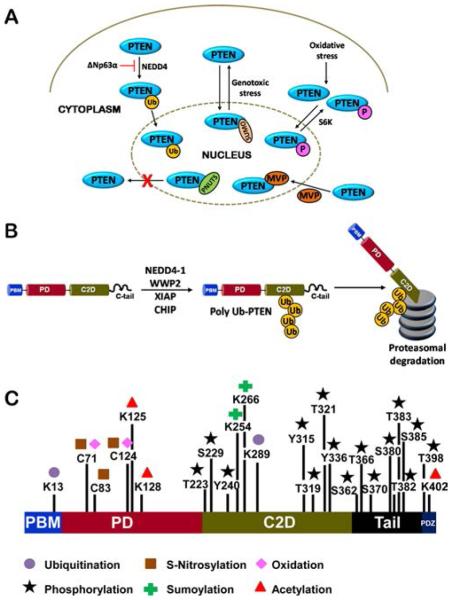
Nongenomic mechanisms of PTEN regulation. (A) Subcellular localization of PTEN. Monoubiquitination and sumoylation modifications on the PTEN protein regulate its nuclear trafficking. Oxidative stress is also known to modulate nuclear PTEN levels. (B) Proteasomal degradation of PTEN. Several E3 ligases like WWP2, CHIP, XIAP and NEDD4-1 cause polyubiquitination and subsequent proteasomal degradation of PTEN. The NEDD4 and CHIP E3 ligases are frequently upregulated in human cancers and negatively correlate with PTEN protein levels. (C) Posttranslational modifications of PTEN. The PTEN protein, like most IDPs, undergoes a vast repertoire of PTMs, each with different functional implications. Of the various modifications, the phosphorylation modifications are best studied and are critical to regulating PTEN function and stability in the cell.
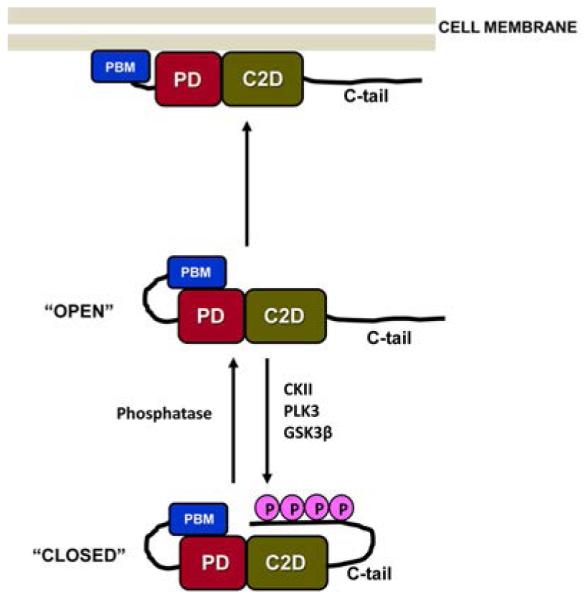
Intramolecular interactions of PTEN. The PTEN molecule forms intramolecular interactions, an event that is dependent on phosphorylation modifications within the disordered C-tail region. Phosphorylation at a serine–threonine cluster (Ser380, Thr382, Thr383, and Ser385) in the C-tail region causes the phosphorylated tail region to fold onto the rest of the PTEN molecule, forming a “closed” conformation. This intramolecular association masks the C2 domain, disallowing interaction of the PTEN molecule with the cell membrane (its site of enzyme action). As a result, the “closed” form of PTEN is enzymatically inactive. However, this “closed” form is relatively resistant to proteasomal degradation. Dephosphorylation of the serine–threonine cluster reverses this intramolecular association, resulting in the “open” conformation of PTEN. “Open” PTEN can now bind to the plasma membrane and dephosphorylate PIP3 to PIP2, thereby keeping the proliferative PI3K/AKT/mTOR pathway in check.
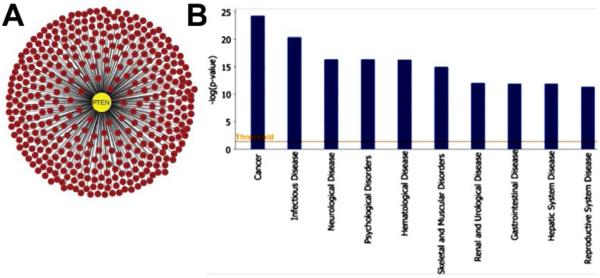
PTEN primary interactome. (A) 395 proteins form the primary interactome of PTEN. (Visualization tool: Cytoscape). (B) Functional analysis of the PTEN primary interactome. UniProt IDs from all the PTEN primary interactome were used as the input for the functional analysis performed by use of the Core Analysis function from the IPA suite (Ingenuity Systems, Mountain View, CA; www.ingenuity.com ). The significance calculated for each function returned in Functional Analysis is a measurement of the likelihood that the function is associated with the data set by random chance. On the y-axis of the diagram, the significance is expressed as the negative exponent of the p-value calculated for each function. Taller histogram bars are more significant than shorter bars. Threshold represents P < 0.05.
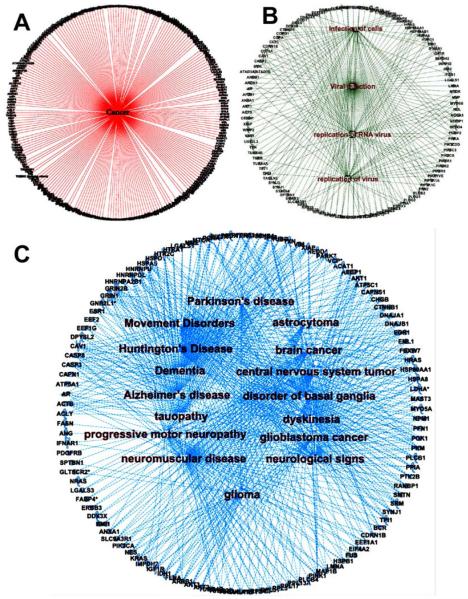
Top enriched networks of PTEN. UniProt IDs of all primary PTEN-interacting proteins were imported into the Ingenuity Pathway Analysis (IPA) Software (Ingenuity Systems, Mountain View, CA; www.ingenuity.com ). By use of the Core Analysis function, the top diseases were identified, and individual networks were visualized by use of the “Display Networks” option. (A) Network depicting all primary PTEN-interacting proteins involved in various types of cancers (P value 5.00 × 10⁻²⁵). (B) Network depicting all primary PTEN-interacting proteins involved in infectious diseases (P value 4.97 × 10⁻²¹). (C) Network depicting all primary PTEN-interacting proteins involved in neurological diseases (P value 4.57 × 10⁻¹⁷).
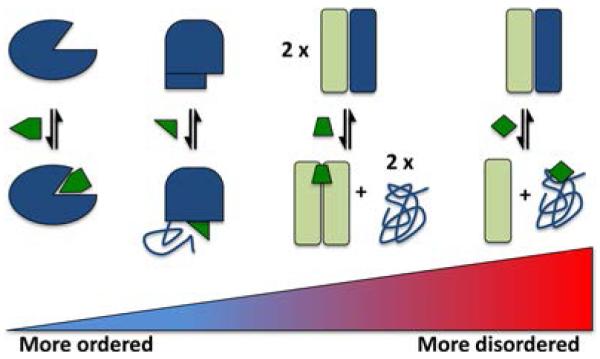
Schematic examples of the continuum of disorder in the binding of small molecules (green) to proteins. On the left is a highly ordered protein (e.g., an enzyme) binding to a small molecule, and on the far right is a small molecule binding directly to a disordered protein and stabilizing the disordered ensemble. In the center are examples of small molecules inducing protein disorder by preventing binding of a disordered region to an ordered partner.
References
-
- Wright PE, Dyson HJ. J. Mol. Biol. 1999;293:321. - PubMed
-
- Uversky VN, Gillespie JR, Fink AL. Proteins: Struct., Funct., Genet. 2000;41:415. - PubMed
-
- Dunker AK, Lawson JD, Brown CJ, Williams RM, Romero P, Oh JS, Oldfield CJ, Campen AM, Ratliff CM, Hipps KW, Ausio J, Nissen MS, Reeves R, Kang C, Kissinger CR, Bailey RW, Griswold MD, Chiu W, Garner EC, Obradovic Z. J. Mol. Graphics Modell. 2001;19:26. - PubMed
-
- Tompa P. Trends Biochem. Sci. 2002;27:527. - PubMed
Publication types
MeSH terms
Substances
Grants and funding
LinkOut - more resources
Full Text Sources
Other Literature Sources
