. 2014 May 15;9(5):e97411.
doi: 10.1371/journal.pone.0097411. eCollection 2014.

Global genetic response in a cancer cell: self-organized coherent expression dynamics

Affiliations

Global genetic response in a cancer cell: self-organized coherent expression dynamics

Masa Tsuchiya et al. PLoS One. .

Erratum in

  • PLoS One. 2014;9(8):e105491

Abstract

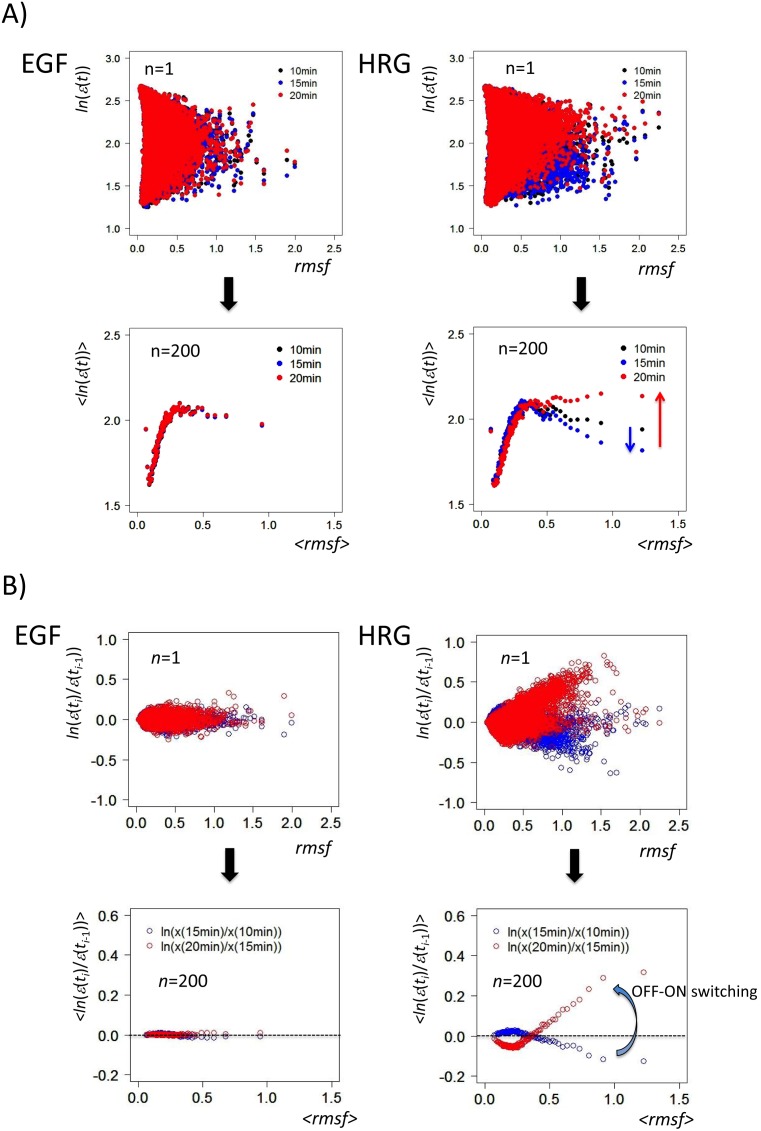
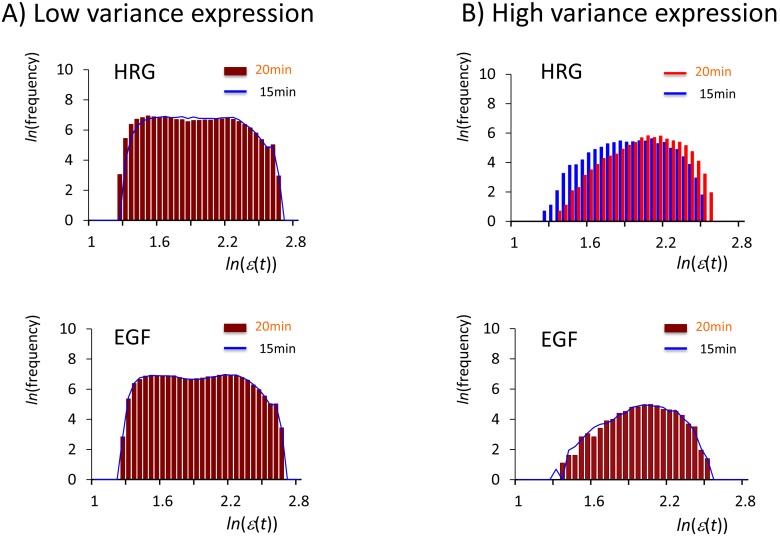
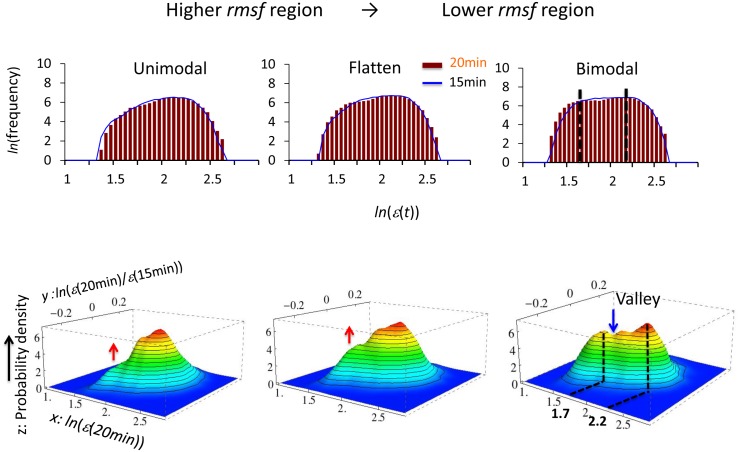
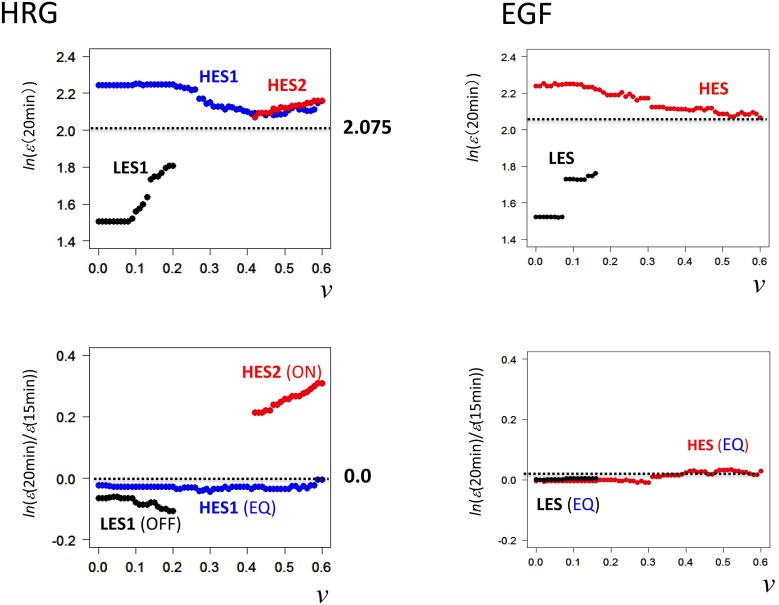
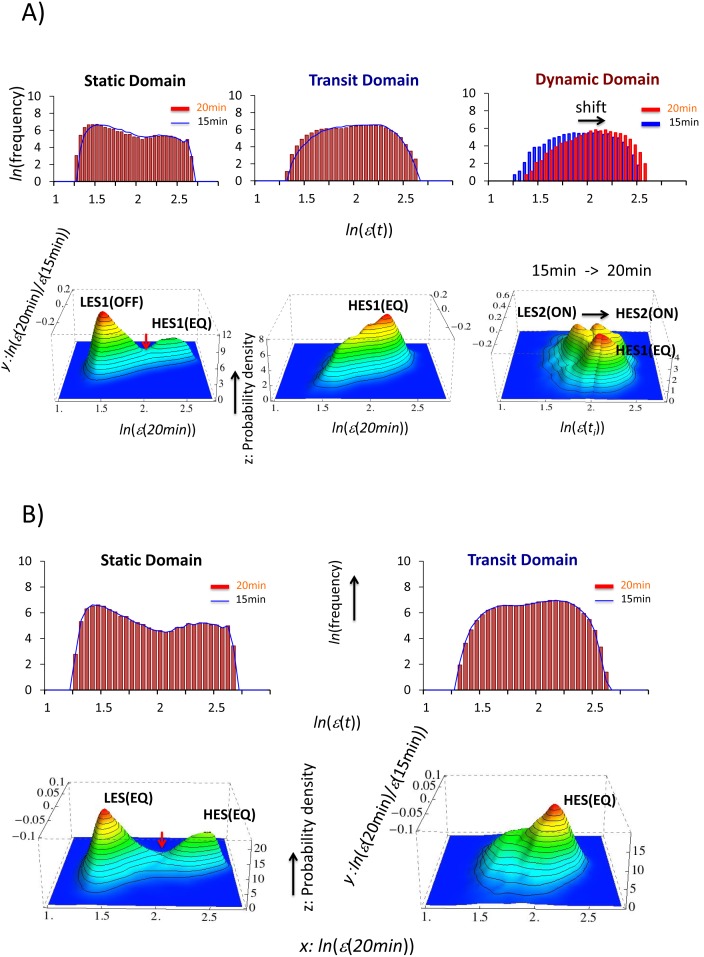
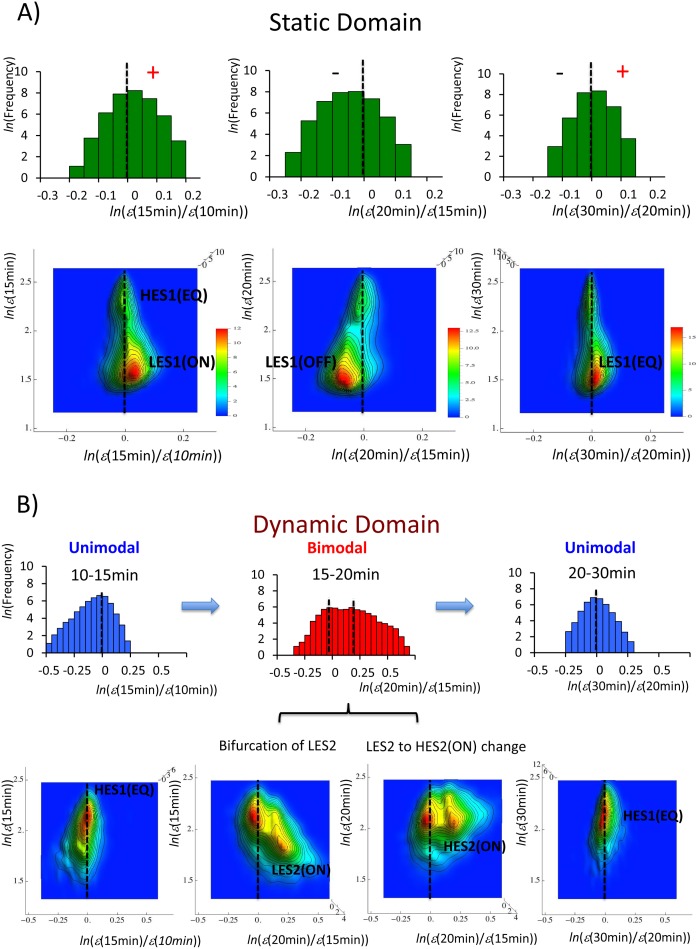
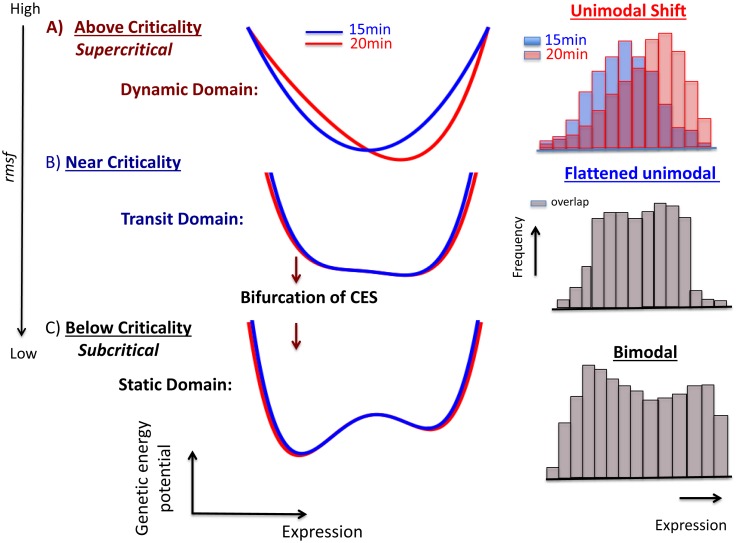
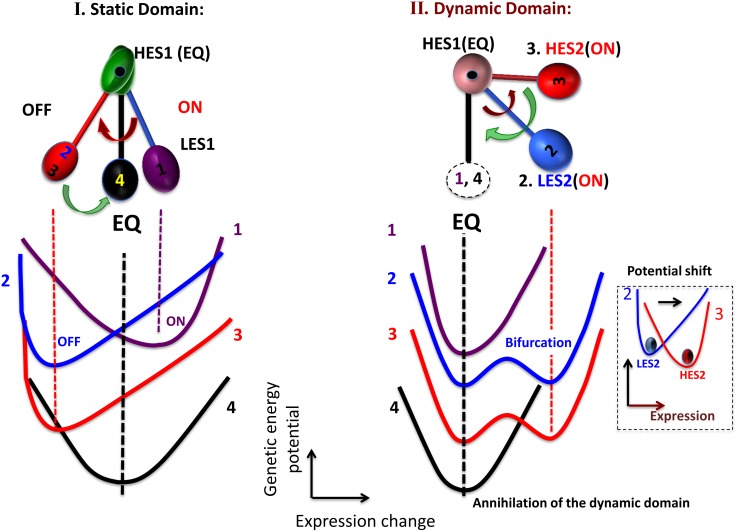
Understanding the basic mechanism of the spatio-temporal self-control of genome-wide gene expression engaged with the complex epigenetic molecular assembly is one of major challenges in current biological science. In this study, the genome-wide dynamical profile of gene expression was analyzed for MCF-7 breast cancer cells induced by two distinct ErbB receptor ligands: epidermal growth factor (EGF) and heregulin (HRG), which drive cell proliferation and differentiation, respectively. We focused our attention to elucidate how global genetic responses emerge and to decipher what is an underlying principle for dynamic self-control of genome-wide gene expression. The whole mRNA expression was classified into about a hundred groups according to the root mean square fluctuation (rmsf). These expression groups showed characteristic time-dependent correlations, indicating the existence of collective behaviors on the ensemble of genes with respect to mRNA expression and also to temporal changes in expression. All-or-none responses were observed for HRG and EGF (biphasic statistics) at around 10-20 min. The emergence of time-dependent collective behaviors of expression occurred through bifurcation of a coherent expression state (CES). In the ensemble of mRNA expression, the self-organized CESs reveals distinct characteristic expression domains for biphasic statistics, which exhibits notably the presence of criticality in the expression profile as a route for genomic transition. In time-dependent changes in the expression domains, the dynamics of CES reveals that the temporal development of the characteristic domains is characterized as autonomous bistable switch, which exhibits dynamic criticality (the temporal development of criticality) in the genome-wide coherent expression dynamics. It is expected that elucidation of the biophysical origin for such critical behavior sheds light on the underlying mechanism of the control of whole genome.


Conflict of interest statement

Competing Interests: Masa Tsuchiya is a PLOS ONE Editorial Board member. This does not alter the authors' adherence to PLOS ONE Editorial policies and criteria.

Figures

Figure 1
Figure 1. Emergence of biphasic dynamic emergent averaging behaviors (DEABs) of the expression and the expression change.
The transition from scattered expression (first row; N = 22035) to time-dependent correlation (second row) is shown as the collective behavior of ensemble groups: DEAB of A) the expression (symbolically represented by ln(ε(t)); called simply ‘the expression’) and B) the expression change (ln(ε(ti)/ε(ti –1))). The image shows biphasic genomic responses (biphasic statistics) to HRG and EGF; plots of single mRNA (n = 1; first row) and a group of genes (n = 200; second row) for A) the expression at t = 10 min (black dot), 15 min (blue), and 20 min (red), and B) the expression change from ti –1 = 10 min to ti = 15 min (blue cycle) and from ti –1 = 15 min to ti = 20 min (red), reflects OFF-ON switching down- to up-regulation). Brackets around x, <x>, reflect the simple arithmetic mean of x in a group (n = 200).
Figure 2
Figure 2. Unimodal to bimodal frequency distribution for DEAB of the expression.
The profiles of the frequency distribution of the expression (ln(ε(t))) from 15 min to 20 min change from unimodal to bimodal for A) high-variance expression (the root mean square fluctuation, rmsf >0.42) and B) low-variance expression (rmsf <0.42). First row: the HRG response for rmsf >0.42 shows a peak-shift of unimodal profiles from t = 15 min (blue histogram) to t = 20 min (red) with a change in the lower to higher value of the expression, while binomial frequency distributions between 15 min (blue polygonal line) and 20 min (red histogram) almost perfectly overlap each other for rmsf <0.42. Second row: the EGF response shows almost the perfect overlap of profiles for both unimodal (rmsf >0.42) and bimodal (rmsf <0.42) distributions, which suggests that there is no temporal averaging response, consistent with DEAB of the expression for the EGF response (Figure 1A). For all histograms in this report, the bin size is set to 0.05.
Figure 3
Figure 3. Existence of coherent expression states (CESs) as hill-like functions.
Plots of single mRNA expression for rmsf >0.42 (blue dot: 15 min and red dot: 20 min) are superimposed in the left panel (first row: 3269 expressions for HRG; second row: 1482 for EGF). In the right panel, the probability density function (PDF) using a Gaussian kernel by Mathematica 9 (default setting) for each point (left panel) reveals hill-like functions in pseudo-3-dimensional space (genetic landscape; z-axis: probability density). Superimposition of the genetic landscapes between ti– 1 = 15 min and ti = 20 min - first row: the HRG response has three CESs; two independent CESs plus one CES that results from the overlap of CESs between 15 min (darker color) and 20 min (lighter color) around a zero change in expression at the y-axis; second row: the EGF response has a single CES as the overlap of two CESs around a zero change in expression. The legend shows a lighter (darker) color bar at 20 min (at 15 min) for PDF.
Figure 4
Figure 4. Onset of the bifurcation of CES for DEAB of the expression (HRG).
The onset of bifurcation of a new CES as the growth of a hill-like function is shown. In the first row, the profile of the frequency distribution of expression changes from unimodal (0.26< rmsf <0.66; left) to bimodal (0.17< rmsf <0.57; right) through a flattened unimodal profile (0.22< rmsf <0.62; center). The genetic landscape (second row) for 15–20 min for each region of rmsf illustrates that the onset of bifurcation of CES transforms from a unimodal to bimodal profile; the red arrow (second row) points to the formation of CES and the blue arrow points to the formation of a valley, which gives rise to a low-expression state (LES). The peaks of the bimodal frequency distribution coincide with the highest density of CESs at around ln(ε) = 1.7 and 2.2 (black dash lines).
Figure 5
Figure 5. Bifurcation of CESs in DEAB of the expression.
The bifurcations of CESs in DEAB of the expression for 15–20 min are examined with an incremental change in a segment, v < rmsf < v + r, as an extension of Figure 4, where the range r is set to 0.4 and v is a variable of rmsf. The bifurcation diagrams of the expression (v against the expression; first row) at t = 20 min, and the expression change (v against the change in the expression for 15–20 min; second row) are plotted for HRG (left panel) and EGF (right). The bifurcation diagram of the expression defines the expression level at ln(ε)  = 2.075 (lower: low- and upper: high-expression) because of the existence of a valley, which separates the low and high CESs (Figure 6), whereas the bifurcation diagram of the expression change shows three activity levels of CES: ON (positive change in the expression), EQ (near zero) and OFF (negative change in the expression). The bifurcation diagrams clearly show distinct characteristic expression domains between HRG and EGF: static, transit and dynamic domains for rmsf <0.21, 0.21< rmsf <0.42, and 0.42< rmsf for HRG, and static and transit domains for rmsf <0.16 and 0.16< rmsf for EGF (see details in the main text).
Figure 6
Figure 6. Genetic landscape of the characteristic expression domains.
Each row (A: HRG and B: EGF) corresponds to frequency distributions of mRNA expression (first) and genetic landscapes (second: side view). In the genetic landscape, a static domain with a valley is characterized by two CESs: A) HES1(EQ) and LES1(OFF) for rmsf <0.21; and B) HES(EQ) and LES(EQ) for rmsf <0.16, a transit domain is characterized by A) HES1(EQ) for 0.21< rmsf <0.42; and B) HES(EQ) for rmsf >0.16, and a dynamic domain is characterized by three CESs: A) LES2(ON), HES2(ON) and HES1(EQ) for rmsf >0.42, which is the result of superimposition of the genetic landscapes between 15 min and 20 min (right panel in the second row); a state shift occurs from LES2(ON) at 15 min to HES2(ON) at 20 min, consistent with the unimodal shift of the frequency distribution (A: first row). The red arrow points to the valley to separate the low and high CESs. The activity level of a coherent expression state (ON, EQ and OFF) refers to Figure 5.
Figure 7
Figure 7. Dynamic motion of the characteristic HRG domains in DEAB of the expression change.
The coordinated expression dynamics around an equilibrated high-expression state exhibit the pendulum oscillation of CES (autonomous bistable switch) between different time periods (10–15 min, 15 min–20 min, and 20–30 min): A) in the static domain (9059 mRNAs) LES1 shows ON-OFF-EQ oscillation around HES1(EQ) through a unimodal shift, and B) in the dynamic domain (3269 mRNAs) the bifurcation of LES2 at 15 min shows a dynamic change from LES2(ON) to HES2(ON) through a unimodal to bimodal profile at 20 min, and the annihilation of HES2 through a bimodal to unimodal profile at 20–30 min around HES2(EQ). The annihilation of HES2 reveals a short-lived dynamic domain. First row: frequency distribution of the expression change. Second row: the genetic landscapes of A) the static domain and B) the dynamic domain from the top view with density color bars.
Figure 8
Figure 8. Schematic illustration of genetic criticality in DEAB of the expression.
The putative genetic energy potential (15 min: blue; 20 min: red) with a fixed change in the expression (see the main text) describes the arrangement of mRNA expression in a transcriptional system, where the profile of the potential is anticipated from the scaling exponent of the frequency distribution of the expression (histograms: right panel; blue: 15 min; red: 20 min; gray: overlapped). The potential profile follows a change from single-well to double-well through a flattening profile as the rmsf is decreased (black arrow). The picture exhibits genetic criticality (details in Table 1 and File S1) as interpreted by the Landau theory on characteristic expression domains for the HRG genomic response: dynamic (dark red), transit (dark blue), and static (black) domains represent above-, near- and below-criticality, respectively. In the above-criticality, due to the unimodal to bimodal shift of the frequency distribution (see also Figure 6A), the energy potential should also be shifted; in the near-criticality and below-criticality due to the overlapping frequency distributions between 15 min and 20 min, the energy potential should be (almost) temporally invariant. Note that, in the double-well potential (below-criticality), instead of generating two independent Boltzmann distributions (two equilibrium states), the frequency distribution shows broken distributions, which suggests non-linear interaction between coherent expression states in a non-equilibrium system.
Figure 9
Figure 9. Schematic illustration of autonomous bistable switch (ABS) with genetic ‘energy profile’ in DEAB of the expression change.
First row: the schematic illustration depicts the temporal development of ABS showing the opposite changes of pendulum oscillation of CES between the static and dynamic domains (refer to Figure 7). In the HRG static domain (left panel), the temporal change of CES (LES1) occurs without the bifurcation of CES; in the dynamic domain (right), the pendulum oscillation occurs through the dynamic bifurcation of CES: bifurcation of a low-expression state with a change in a putative potential profile from single- to double-well at 15 min, a change from the low- to the high-expression state at 20 min (refer to Figure 6A) with a single-well potential shift (small dashed box), and annihilation of the high-expression state with a change from double- to single-well at 20–30 min. Second row: schematic illustration describes the dynamics of the genetic energy potential as a function of the expression change (with a fixed expression; see details in the main text): 1. purple line: 10–15 min (at 15 min); 2. blue: 15–20 min (at 15 min); 3. red: 15–20 min (at 20 min); 4. black: 20–30 min (at 30 min). The picture shows the energy flow between the pendulum motions, which reflects the non-equilibrium dynamics of CES.

References

    1. Takahashi K, Yamanaka S (2006) Induction of pluripotent stem cells from mouse embryonic and adult fibroblast cultures by defined factors. Cell 131: 861–872. - PubMed
    1. Kouzarides T (2007) Chromatin modifications and their function. Cell 128: 693–705. - PubMed
    1. Klevecz RR, Bolen J, Forrest G, Murray DB (2004) A genomewide oscillation in transcription gates DNA replication and cell cycle. Proc Natl Acad Sci USA 100: 1200–1205. - PMC - PubMed
    1. Radonjic M, Andrau JC, Lijnzaad P, Kemmeren P, Kockelkorn TTJP, et al. (2005) Genome-wide analyses reveal RNA polymerase II located upstream of genes poised for rapid response upon S-cerevisiae stationary phase exit. Mol Cell 18: 171–183. - PubMed
    1. Young RA (2011) Control of the embryonic stem cell state. Cell 144: 940–954. - PMC - PubMed

Publication types