. 2014 May 15;9(5):e97556.
doi: 10.1371/journal.pone.0097556. eCollection 2014.

How do you solve a problem like Letharia? A new look at cryptic species in lichen-forming fungi using Bayesian clustering and SNPs from multilocus sequence data

Affiliations

How do you solve a problem like Letharia? A new look at cryptic species in lichen-forming fungi using Bayesian clustering and SNPs from multilocus sequence data

Susanne Altermann et al. PLoS One. .

Abstract

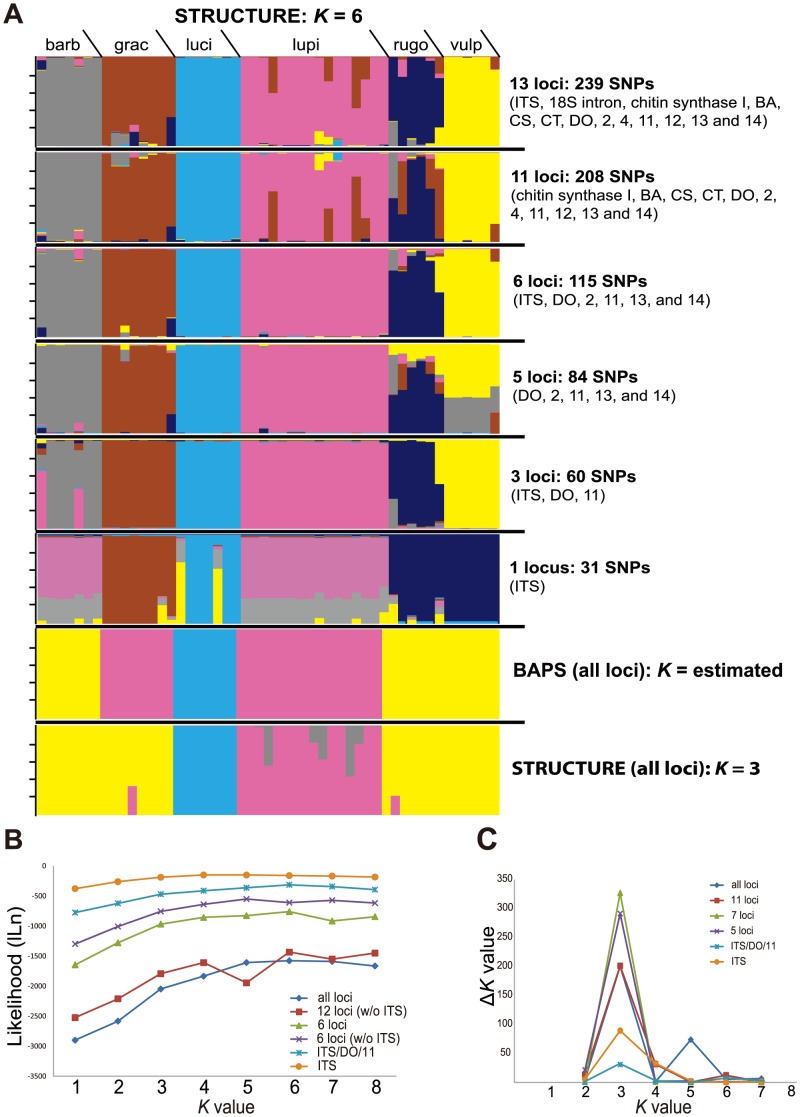
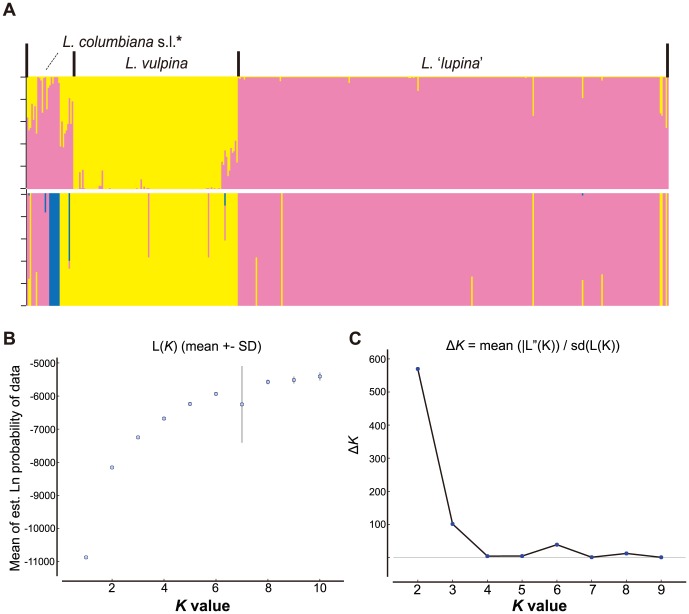
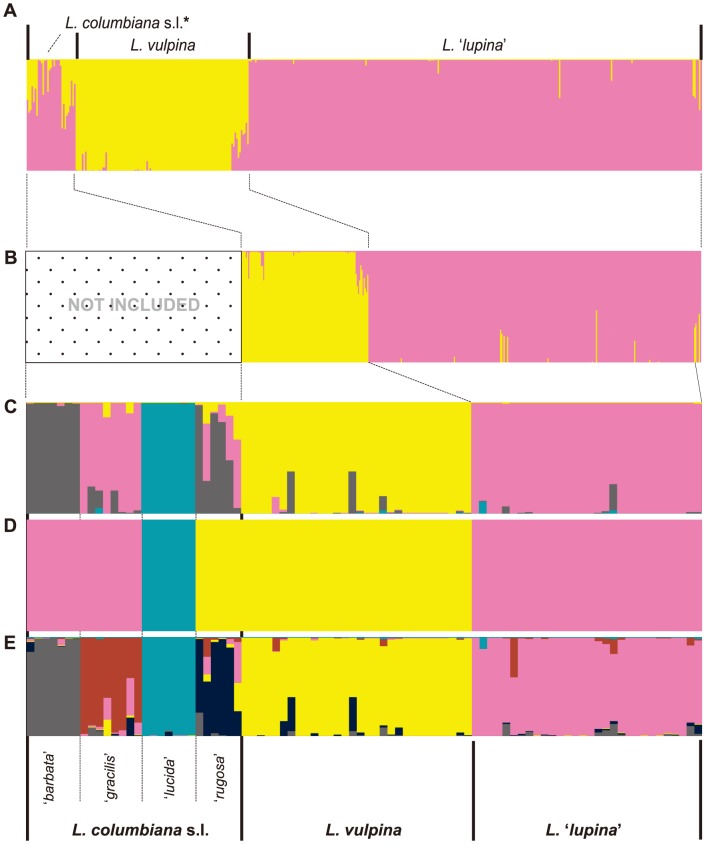
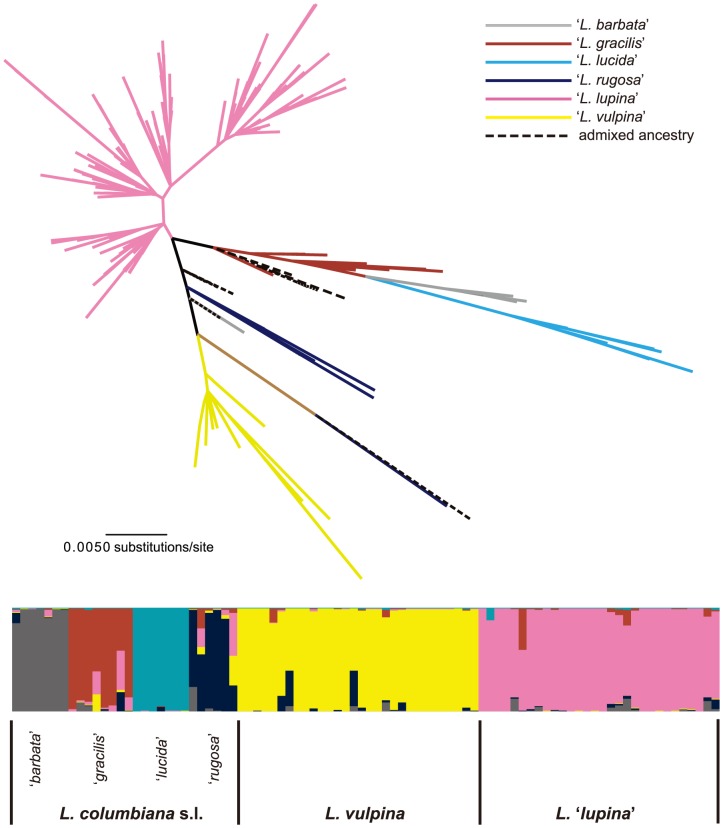
The inclusion of molecular data is increasingly an integral part of studies assessing species boundaries. Analyses based on predefined groups may obscure patterns of differentiation, and population assignment tests provide an alternative for identifying population structure and barriers to gene flow. In this study, we apply population assignment tests implemented in the programs STRUCTURE and BAPS to single nucleotide polymorphisms from DNA sequence data generated for three previous studies of the lichenized fungal genus Letharia. Previous molecular work employing a gene genealogical approach circumscribed six species-level lineages within the genus, four putative lineages within the nominal taxon L. columbiana (Nutt.) J.W. Thomson and two sorediate lineages. We show that Bayesian clustering implemented in the program STRUCTURE was generally able to recover the same six putative Letharia lineages. Population assignments were largely consistent across a range of scenarios, including: extensive amounts of missing data, the exclusion of SNPs from variable markers, and inferences based on SNPs from as few as three gene regions. While our study provided additional evidence corroborating the six candidate Letharia species, the equivalence of these genetic clusters with species-level lineages is uncertain due, in part, to limited phylogenetic signal. Furthermore, both the BAPS analysis and the ad hoc ΔK statistic from results of the STRUCTURE analysis suggest that population structure can possibly be captured with fewer genetic groups. Our findings also suggest that uneven sampling across taxa may be responsible for the contrasting inferences of population substructure. Our results consistently supported two distinct sorediate groups, 'L. lupina' and L. vulpina, and subtle morphological differences support this distinction. Similarly, the putative apotheciate species 'L. lucida' was also consistently supported as a distinct genetic cluster. However, additional studies will be required to elucidate the relationships of other L. columbiana s.l. populations with the two sorediate genetic clusters.


Conflict of interest statement

Competing Interests: The authors have declared that no competing interests exist.

Figures

Figure 1
Figure 1. Morphological variation in Letharia.
A. L. vulpina population on Pinus jeffreyi in the Pine Mountains in southern California, USA (photo credit: Jason Hollinger). B. Habit shot of L. ‘lupina’ on dead Pinus branch, Jackman Flats, British Columbia, Canada (photo credit: Jason Hollinger). C. Habit shot of L. columbiana s.l. on Pinus ponderosa in the eastern Cascades, Washington, USA (photo credit: Richard Droker).
Figure 2
Figure 2. Results from Bayesian clustering analyses of 51 Letharia specimens from .
A. Individual assignments within population clusters in Letharia inferred using the Program BAPS and STRUCTURE; vertical bars represent individual assignment probability into different genetic clusters depicted with colors; the six uppermost panels depict individual population assignments under a variety of combinations of SNP data using a K = 6 model; and the lower two panels depict individual assignments inferred using BAPS (estimating the number of genetic clusters) and the K = 3 model from the STRUCTURE analysis (based on results from the ad hoc statistic ΔK); and order of individuals is identical across panels. B. Plot of mean likelihood values for each K (1–8), based on 10 replicates per K, from the STRUCTURE analysis of the sampled Letharia specimens. C. Results from the ΔK analysis, following Evanno et al. ; the modal value of this distribution is the uppermost level of structure (K).
Figure 3
Figure 3. Results from Bayesian clustering analyses of 432 Letharia specimens using SNP data from a total of 15 gene regions.
A. Individual ancestry within population clusters in Letharia inferred using the Program BAPS and STRUCTURE; vertical bars represent individual assignment probability into different genetic clusters depicted with colors; the top panel depicts individual population assignments inferred under the K = 2 model from the STRUCTURE analysis (based on results from the ad hoc statistic ΔK); and the lower panel depict individual assignments inferred using BAPS (estimating the number of genetic clusters), where a third genetic cluster (depicted in blue) represents the putative apotheciate species L. ‘lucida.’; order of individuals is identical across panels B. Plot of likelihood values for each K (1–10), based on 10 replicates per K, from the STRUCTURE analysis of the sampled Letharia specimens. C. Results from the ΔK analysis, following Evanno et al. ; the modal value of this distribution is the uppermost level of structure (K).
Figure 4
Figure 4. Results from Bayesian clustering analyses of Letharia samples under a variety of scenarios.
Vertical bars represent individual assignment probability into different genetic clusters depicted with colors. A. Individual population assignments based on the STRUCTURE analysis of 432 Letharia specimens inferred under the K = 2 model based results from the ad hoc statistic ΔK (identical to the top panel in Fig. 3A). B. Individual population assignments based on the STRUCTURE analysis excluding specimens representing L. columbiana s.l. and strictly representing sorediate forms L. ‘lupina’ and L. vulpina, inferred under the K = 2 model based results from the ad hoc statistic ΔK (see Supplementary Fig S1). C. Individual population assignments inferred under the K = 4 model from the STRUCTURE analysis (based on results from the ad hoc statistic ΔK; Supplementary Fig S2) in the dataset with normalized sample sizes for the two sorediate clusters. D. Individual assignments inferred using BAPS (estimating the number of genetic clusters) from the dataset with normalized sample sizes for the two sorediate clusters. E. Individual population assignments inferred under the K = 6 model from the STRUCTURE analysis (based on previous hypothesis of six species-level lineage in Letharia) from the dataset with normalized sample sizes for the two sorediate clusters. Order of individuals is identical across panels.
Figure 5
Figure 5. Likelihood mapping analysis of the concatenated 15-locus dataset from 432 Letharia samples.
Upper panel shows the distribution pattern of all quartets and the lower panel depicts the fraction of each occupied region. The values in the panels indicated proportion of fully resolved (corners), partially resolved (along the sides), and fully unresolved quartets (in the center).
Figure 6
Figure 6. Unrooted maximum likelihood tree estimated from a concatenated 15-gene data matrix representing from 432 Letharia specimens.
Colored branches correspond to population genetic clusters from the K = 6 model in the STRUCTURE analysis (shown in the lower panel [figure is identical to Fig. 4E]). Only ‘L. barbata’ and ‘L. lucida’ were recovered with bootstrap values >50, with bootstrap values of 69% and 100% bootstrap values, respectively.

References

    1. Mayr E (1970) Populations, species, and evolution. Cambridge, Massachusetts: Belknap Press of Harvard University Press.
    1. Carstens BC, Pelletier TA, Reid NM, Satler JD (2013) How to fail at species delimitation. Mol Ecol 22: 4369–4383. - PubMed
    1. Yeates DK, Seago A, Nelson L, Cameron SL, Joseph LEO, et al. (2011) Integrative taxonomy, or iterative taxonomy? Syst Entomol 36: 209–217.
    1. Miralles A, Vences M (2013) New metrics for comparison of taxonomies reveal striking discrepancies among species delimitation methods in Madascincus lizards. PLoS ONE 8: e68242. - PMC - PubMed
    1. Fujita MK, Leaché AD, Burbrink FT, McGuire JA, Moritz C (2012) Coalescent-based species delimitation in an integrative taxonomy. Trends Ecol Evol 9: 480–488. - PubMed

Publication types

LinkOut - more resources