. 2014 May 15;10(5):e1003628.
doi: 10.1371/journal.pcbi.1003628. eCollection 2014 May.

Genomic characterization of large heterochromatic gaps in the human genome assembly

Affiliations

Genomic characterization of large heterochromatic gaps in the human genome assembly

Nicolas Altemose et al. PLoS Comput Biol. .

Abstract

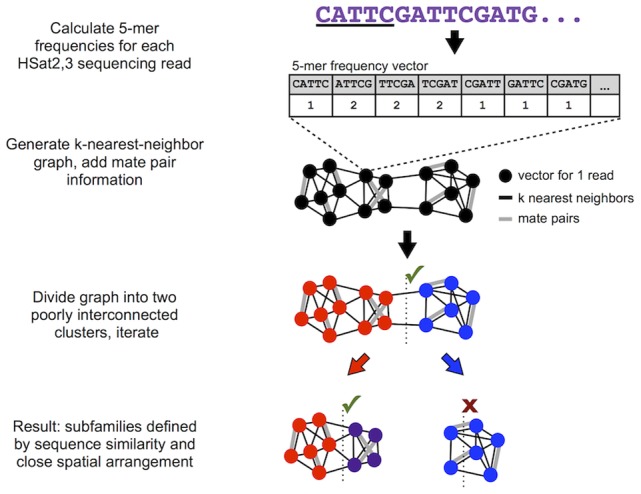
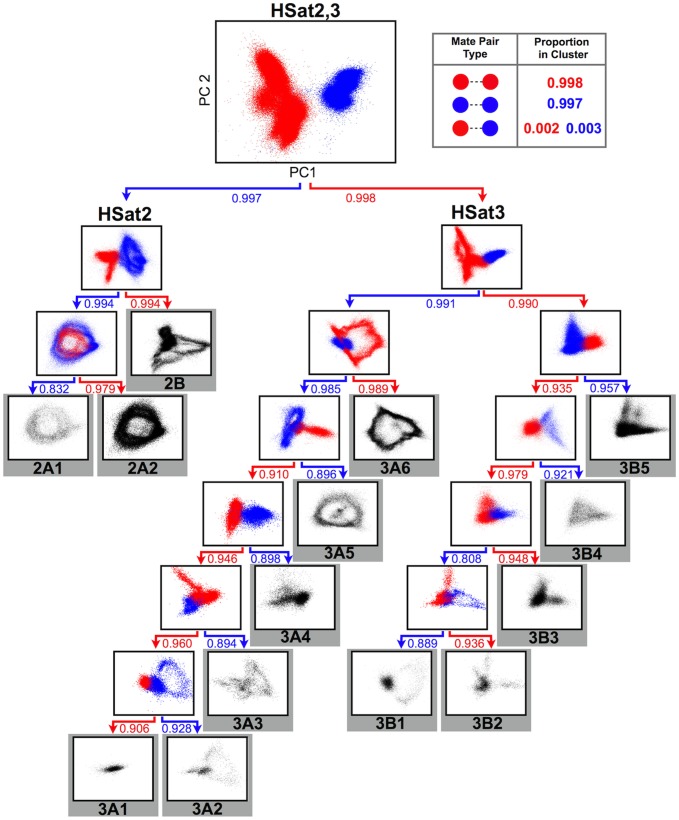
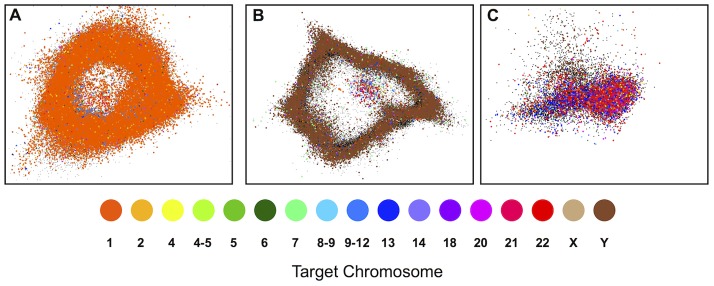
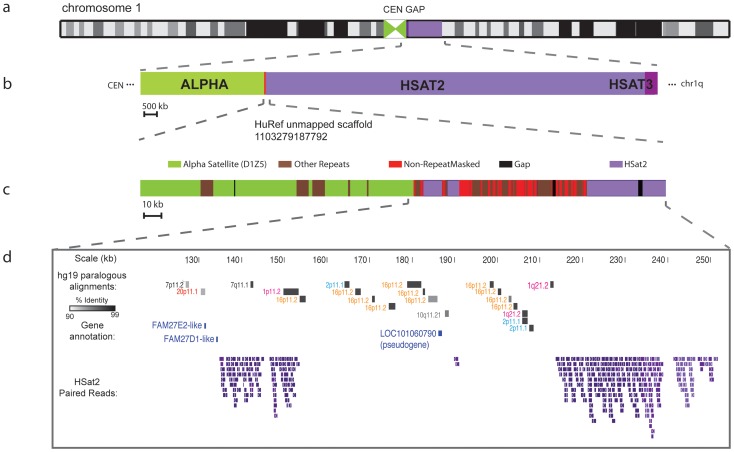
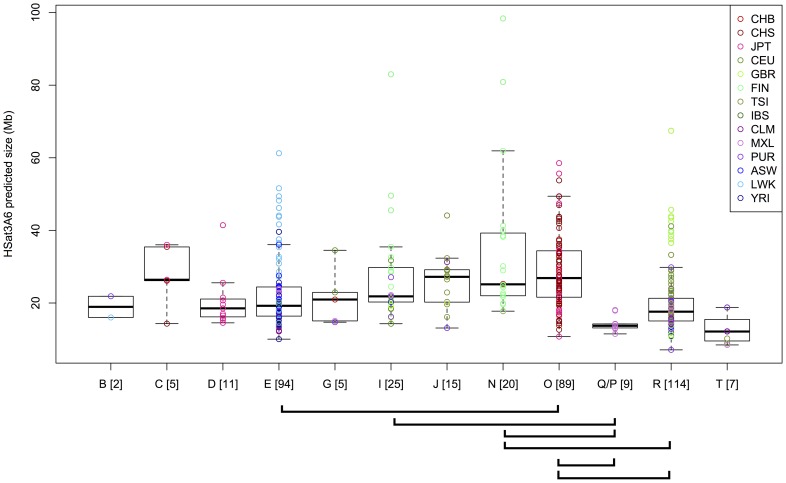
The largest gaps in the human genome assembly correspond to multi-megabase heterochromatic regions composed primarily of two related families of tandem repeats, Human Satellites 2 and 3 (HSat2,3). The abundance of repetitive DNA in these regions challenges standard mapping and assembly algorithms, and as a result, the sequence composition and potential biological functions of these regions remain largely unexplored. Furthermore, existing genomic tools designed to predict consensus-based descriptions of repeat families cannot be readily applied to complex satellite repeats such as HSat2,3, which lack a consistent repeat unit reference sequence. Here we present an alignment-free method to characterize complex satellites using whole-genome shotgun read datasets. Utilizing this approach, we classify HSat2,3 sequences into fourteen subfamilies and predict their chromosomal distributions, resulting in a comprehensive satellite reference database to further enable genomic studies of heterochromatic regions. We also identify 1.3 Mb of non-repetitive sequence interspersed with HSat2,3 across 17 unmapped assembly scaffolds, including eight annotated gene predictions. Finally, we apply our satellite reference database to high-throughput sequence data from 396 males to estimate array size variation of the predominant HSat3 array on the Y chromosome, confirming that satellite array sizes can vary between individuals over an order of magnitude (7 to 98 Mb) and further demonstrating that array sizes are distributed differently within distinct Y haplogroups. In summary, we present a novel framework for generating initial reference databases for unassembled genomic regions enriched with complex satellite DNA, and we further demonstrate the utility of these reference databases for studying patterns of sequence variation within human populations.


Conflict of interest statement

The authors have declared that no competing interests exist.

Figures

Figure 1
Figure 1. Overview of approach used to characterize satellite sequences.
This shows a simplified graphic representation of our overall approach for identifying satellite subfamilies given whole-genome shotgun read data. The actual spectral clustering algorithm is applied in the full 1024-dimension feature space using 50-nearest-neighbor edges weighted according to Euclidean distance.
Figure 2
Figure 2. Recursive identification of highly connected subgraphs identifies fourteen HSat2,3 subfamilies.
This tree illustrates the iterative binary divisions of the complete HSat2,3 dataset into subfamilies. Each plot is a PCA projection (on principal components 1 and 2) of the normalized 5-mer frequency vectors for all reads in that subgraph. Each point corresponds to one read, colored red or blue by its cluster assignment. Final cluster projections are colored black. The box at the upper right illustrates the concept of self-mate-pair frequencies within the first subgraph division. Arrows below each subgraph are labeled with the self-mate-pair frequency of each daughter cluster, and they are colored to match their cluster of origin in the parent subgraph.
Figure 3
Figure 3. Ring-like topology of HSat2,3 subfamily projections reflects tandem repeat unit organization.
Feature vectors representing simulated reads from a 1.77 kb clone sequence from the HSat2 array on chromosome 1 are colored by their starting position on the clone sequence and overlaid on a PCA projection of HSat2A2 reads (black). Arrows below this plot illustrate the tandem nature of the 1.77 kb repeat, which yields the observed ring-like projection as reads are sampled from different subregions of the tandem repeat unit.
Figure 4
Figure 4. Reads from flow-sorted chromosomes are useful in assigning genome-wide distributions of HSat2,3 subfamilies.
Read feature vectors from flow-sorted chromosome datasets (colored according to targeted chromosome(s)) are overlaid on PCA projections of the read databases (colored black) for (A) HSat2A2, (B) HSat3A6, and (C) HSat3A4. The plots qualitatively show enrichment for chromosomes 1, Y, and the acrocentrics, respectively. This enrichment is quantitatively and precisely measured in order to infer the chromosomal localization of each subfamily (see Methods).
Figure 5
Figure 5. Unmapped scaffold uniquely mapped to HSat2-rich region on chromosome 1.
This unmapped scaffold (HuRef SCAF_1103279187792) defines an inter-satellite region in the large centromeric/heterochromatin gap on chromosome 1 (a), which is located between alpha satellite (centromeric region) and Human Satellites 2,3 (heterochromatic gap) (b). It contains roughly 60kb of non-RepeatMasked sequence (c), most of which represents ancient segmental duplications to the pericentromeric regions of chromosomes 1, 2, 7, 10, 16, and 20. Also shown are the positions of annotated gene predictions and HSat2-containing reads used in the assembly of this scaffold (d).
Figure 6
Figure 6. HSat3A6 (DYZ1) array size estimates in 396 individuals.
Each circle represents an HSat3A6 size estimate for a single individual, and it is colored by the population designation of that individual. Individuals are grouped by Y haplogroup assignments, and boxplots illustrate the distribution of array sizes within each haplogroup. Brackets below the plot indicate pairs of haplogroups with p<0.001 in a pairwise, two-sided, two-sample Wilcoxon rank-sum test (with Holm correction for multiple testing), indicating a location shift in the distributions of array sizes between these haplogroups.

References

    1. Yunis J, Yasmineh WG (1971) Heterochromatin, Satellite DNA, and Cell Function. Science 174: 1200–1209. - PubMed
    1. Pardue ML, Gall JG (1970) Chromosomal localization of mouse satellite DNA. Science 168: 1356–1358. - PubMed
    1. Hacch FT, Mazrimas JA (1974) Fractionation and characterization of satellite DNAs of the kangaroo rat (Dipodomys ordii). Nucleic acids research 1: 559–576. - PMC - PubMed
    1. Melters DP, Bradnam KR, Young HA, Telis N, May MR, et al. (2013) Comparative analysis of tandem repeats from hundreds of species reveals unique insights into centromere evolution. Genome Biol 14: R10. - PMC - PubMed
    1. Alkan C, Ventura M, Archidiacono N, Rocchi M, Sahinalp SC, et al. (2007) Organization and evolution of primate centromeric DNA from whole-genome shotgun sequence data. PLoS Comput Biol 3: 1807–1818. - PMC - PubMed

Publication types