. 2014 Aug;32(8):2033-47.
doi: 10.1002/stem.1730.

The zinc finger transcription factor ZFX is required for maintaining the tumorigenic potential of glioblastoma stem cells

Affiliations

The zinc finger transcription factor ZFX is required for maintaining the tumorigenic potential of glioblastoma stem cells

Xiaoguang Fang et al. Stem Cells. 2014 Aug.

Abstract

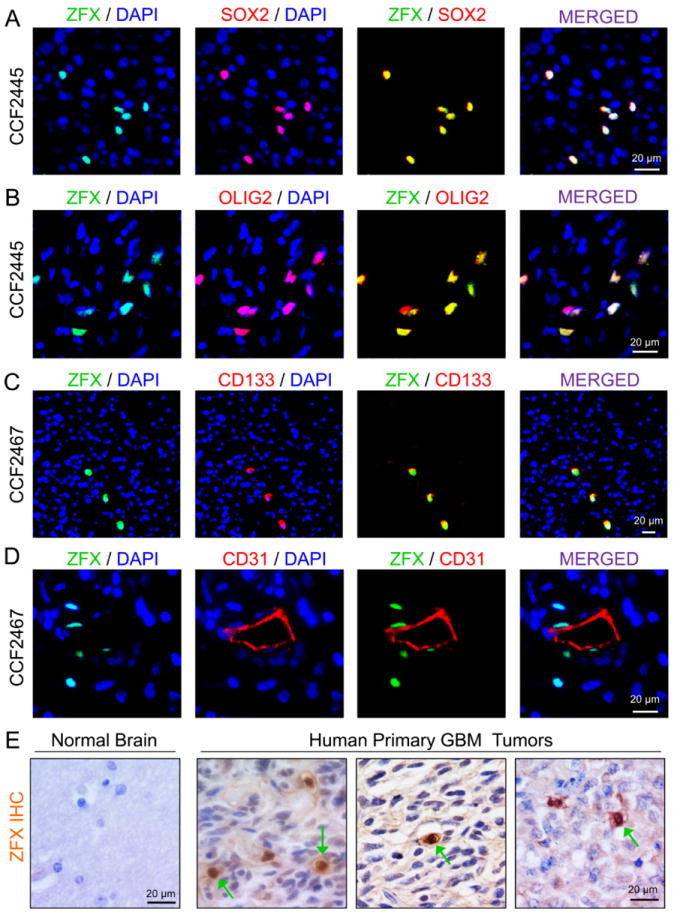
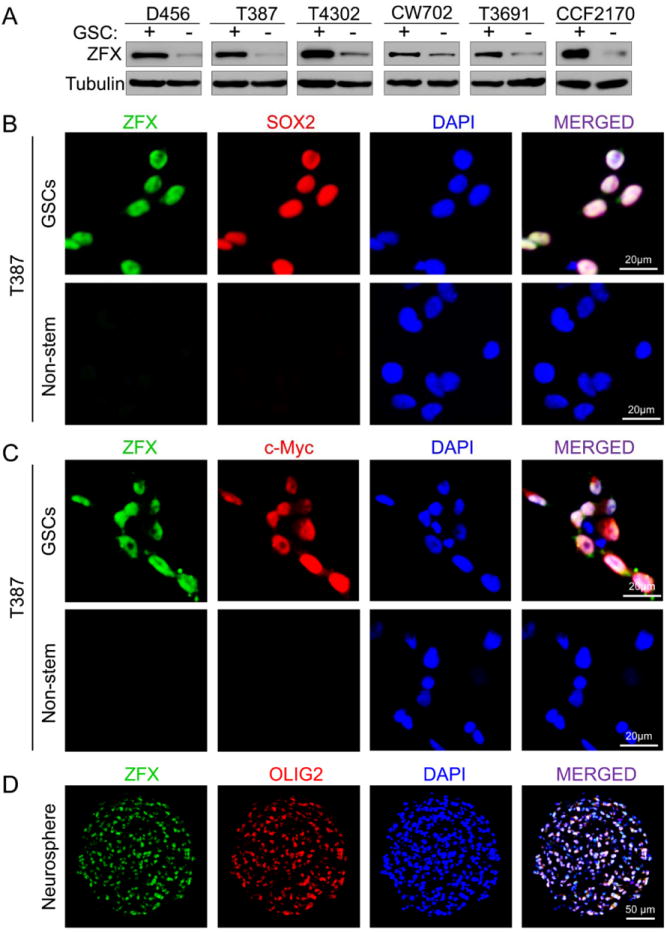
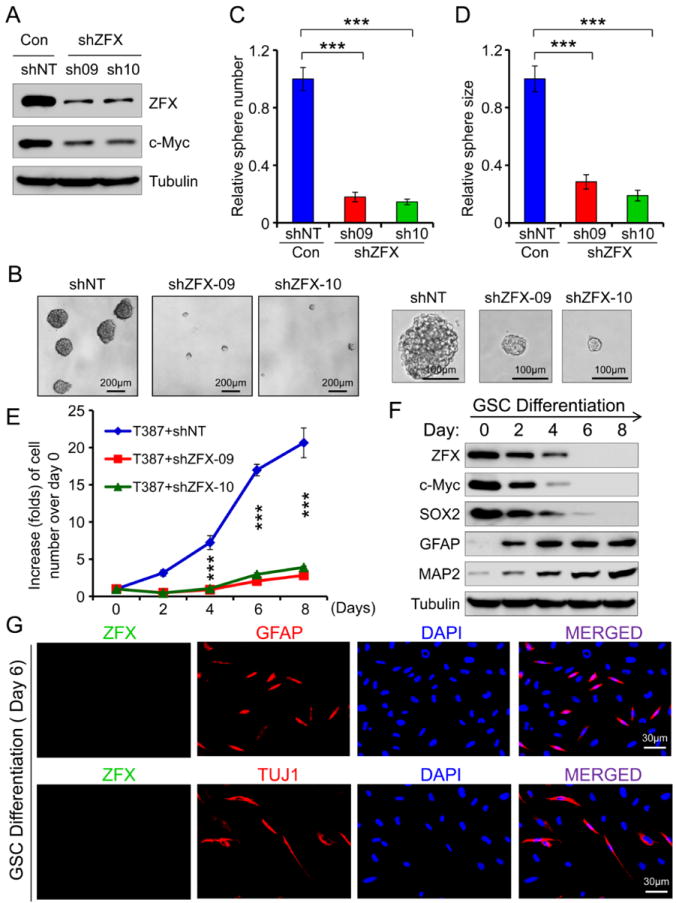
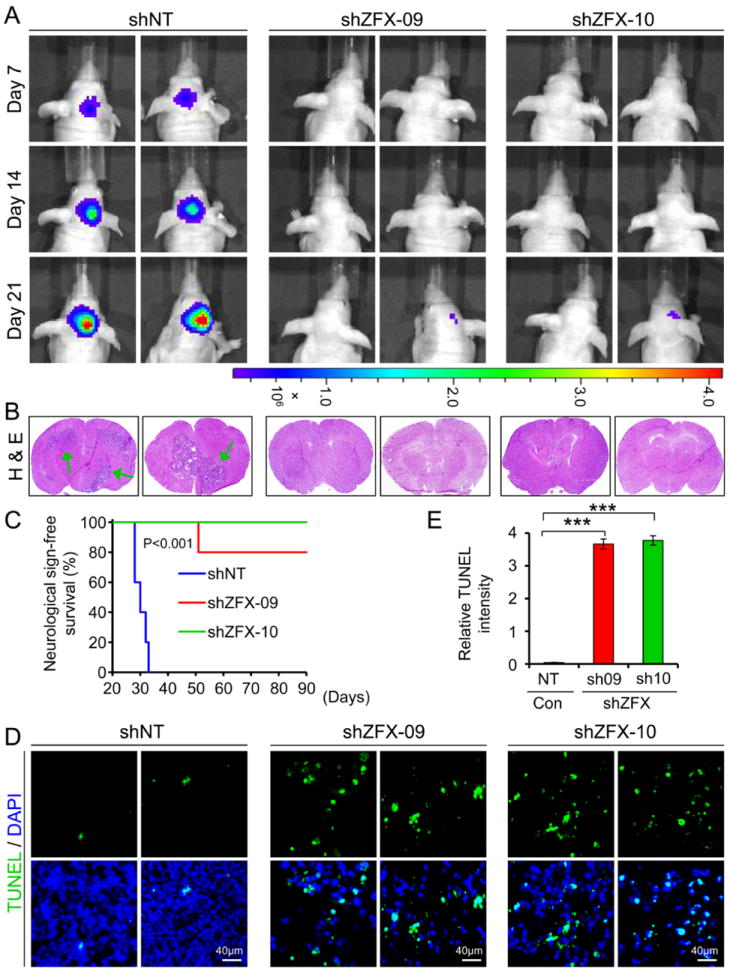
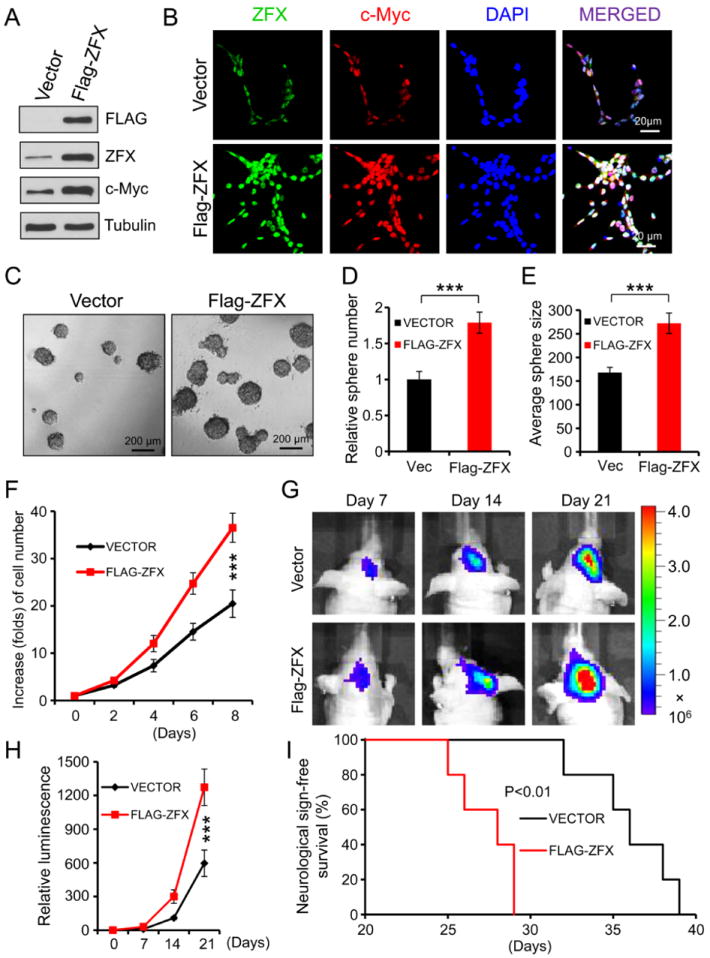
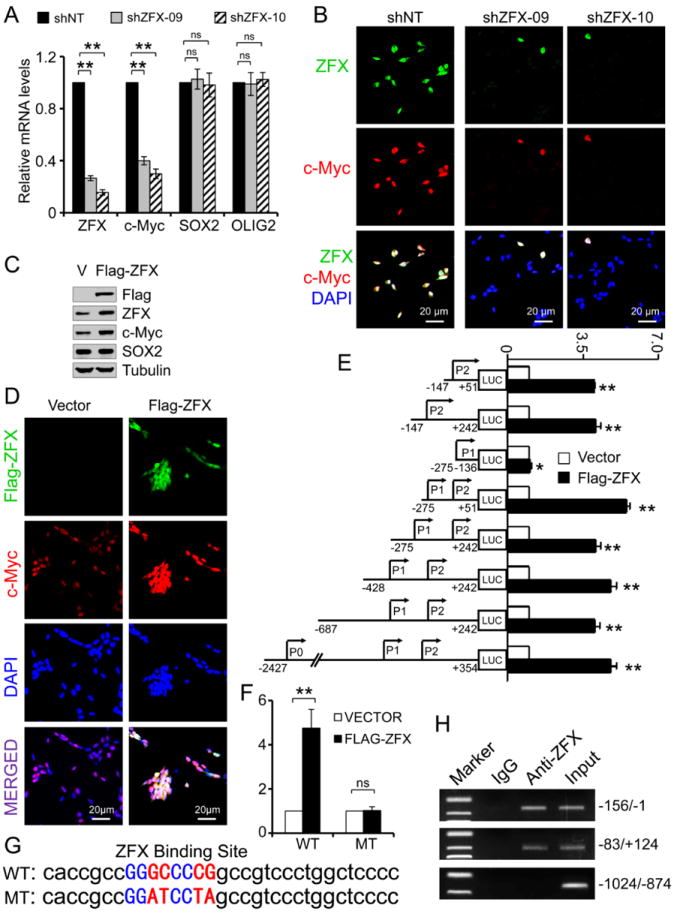
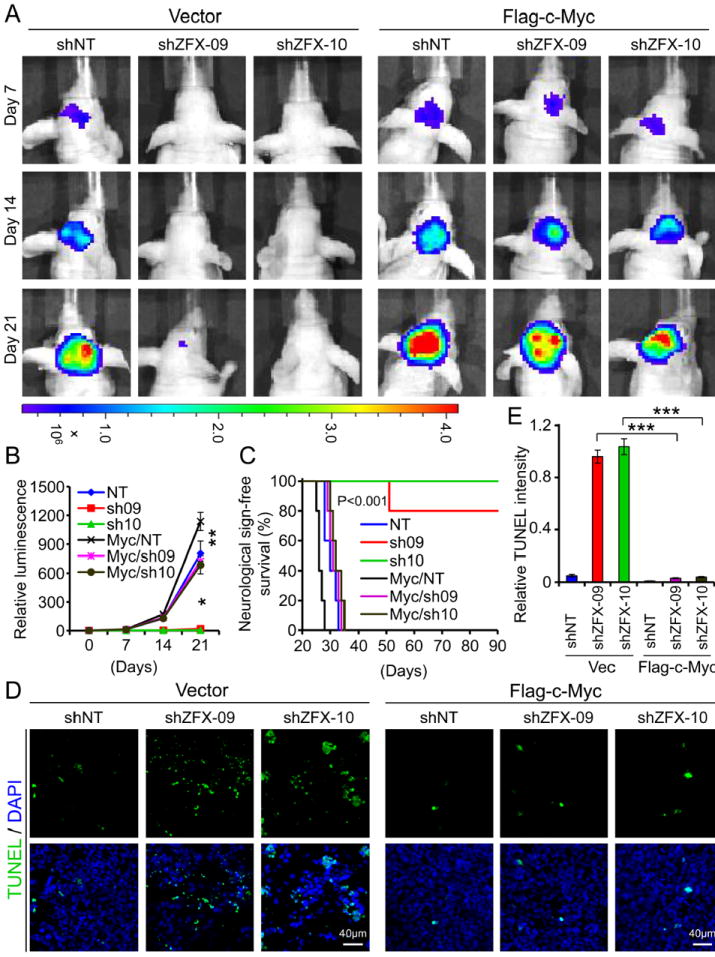
Glioblastomas are highly lethal brain tumors containing tumor-propagating glioma stem cells (GSCs). The molecular mechanisms underlying the maintenance of the GSC phenotype are not fully defined. Here we demonstrate that the zinc finger and X-linked transcription factor (ZFX) maintains GSC self-renewal and tumorigenic potential by upregulating c-Myc expression. ZFX is differentially expressed in GSCs relative to non-stem glioma cells and neural progenitor cells. Disrupting ZFX by shRNA reduced c-Myc expression and potently inhibited GSC self-renewal and tumor growth. Ectopic expression of c-Myc to its endogenous level rescued the effects caused by ZFX disruption, supporting that ZFX controls GSC properties through c-Myc. Furthermore, ZFX binds to a specific sequence (GGGCCCCG) on the human c-Myc promoter to upregulate c-Myc expression. These data demonstrate that ZFX functions as a critical upstream regulator of c-Myc and plays essential roles in the maintenance of the GSC phenotype. This study also supports that c-Myc is a dominant driver linking self-renewal to malignancy.

Keywords: Cancer stem cell; Glioblastoma; Self-renewal; Tumorigenesis; Zinc finger and X-linked transcription factor; c-Myc.


Conflict of interest statement

Disclosure Of Potential Conflicts Of Interests

The authors declare no potential conflicts of interests.

Figures

Figure 1
Figure 1
ZFX is preferentially expressed in a fraction of cancer cells expressing GSC markers in primary GBMs. (A-C): Immunofluorescence (IF) staining of ZFX and GSC markers in primary GBMs. Frozen sections of GBM tumors (CCF2445 and CCF2467) were co-immunostained with specific antibodies against ZFX (in green) and a GSC marker (SOX2, OLIG2 or CD133, in red) and then counterstained with DAPI to show nuclei (in blue). ZFX is co-expressed in the cancer cells expressing the GSC markers. (D): IF staining of ZFX (in green) and the endothelial cell marker CD31 (in red) in a primary GBM. Sections were counterstained with DAPI (in blue). ZFX-expressing cells are localized in the perivascular niche. (E): Immunohistochemical (IHC) staining of ZFX in human brain tissue and primary GBMs. Tissue sections were counterstained with hematoxylin to mark nuclei. The positive cells (indicated by green arrows) are shown in brown color. Scale bars represent 20 μm.
Figure 2
Figure 2
ZFX is differentially expressed in GSCs relative to non-stem tumor cells. (A): Immunoblot analysis of ZFX protein levels in matched GSCs (+) and non-stem tumor cells (-) isolated from six primary GBM tumors or GBM xenografts. (B and C): IF staining of ZFX and the GSC markers in matched T387 GSCs and non-stem tumor cells. The sorted GSCs and non-stem tumor cells from a GBM tumor (T387) were co-immunostained with specific antibodies against ZFX (in green) and a GSC marker (SOX2 or c-Myc, in red) and then counterstained with DAPI to show nuclei (in blue). (D): IF staining of ZFX (in green) and the GSC marker OLIG2 (in red) on frozen sections of T4121 GSC tumorspheres. Sections were counterstained with DAPI to mark nuclei (in blue). ZFX and OLIG2 were co-expressed in the majority of cells in the GSC tumorspheres. Scale bars represent 20 μm (B and C) and 50 μm (D).
Figure 3
Figure 3
ZFX is required for the maintenance of GSC self-renewal and growth in vitro. (A): Immunoblot analysis of ZFX and c-Myc in the GSCs transduced with ZFX shRNA (sh09 and sh10) or non-targeting (NT) shRNA (control). ZFX knockdown by shRNA reduced c-Myc expression in the GSCs. (B-D): Tumorsphere formation of T387 GSCs expressing shZFX (sh09 or sh10) or NT shRNA. Disrupting ZFX impaired GSC tumorsphere formation (B). Quantifications show that ZFX knockdown significantly reduced the GSC tumorsphere number (C) and size (D). ***, p<0.001. (E): Growth curves of GSCs expressing shZFX or NT shRNA (control). GSCs were transduced with shZFX (sh09 or sh10) or NT shRNA and then measured for cell growth over a time course. Disrupting ZFX significantly inhibited GSC growth. ***, p<0.001. (F): Immunoblot analysis of ZFX, the GSC markers (c-Myc and SOX2) and the differentiation markers (GFAP and MAP2) during differentiation of GSCs. ZFX, c-Myc and SOX2 gradually decreased while the differentiation markers GFAP (for astrocytes) and MAP2 (for neuronal lineages) increased during the differentiation. (G): IF staining of ZFX (in green) and GFAP (in red) or TUJ1 (a neuronal marker, in red) in differentiated cells (day 6) derived from GSCs (CCF2170). Nuclei were stained with DAPI (in blue). The differentiated cells lost ZFX expression. Scale bars represent 30 μm (G). Data are means ± SD.
Figure 4
Figure 4
Disrupting ZFX potently inhibited GSC tumor growth and significantly increased survival of animals bearing the xenografts. (A): In vivo bioluminescent imaging of GBM xenografts derived from luciferase-labeled GSCs expressing shZFX (sh09 or sh10) or NT shRNA. GSCs (T387) were transduced with firefly luciferase and shZFX or NT shRNA through lentiviral infection, and then transplanted into brains immunocompromised mice. Mice bearing the intracranial xenografts were monitored after the GSC transplantation. Representative images at indicated days post-injection are shown. (B): Representative images of cross sections (hematoxylin and eosin stained) of mouse brains harvested on day 21 post-transplantation of the GSCs expressing shZFX or NT shRNA. Arrows indicated tumors in brains. No tumor or only small tumor was found in brains implanted with the GSCs expressing shZFX. (C): Kaplan-Meier survival curves of mice implanted with GSCs expressing shZFX (sh09 or sh10) or NT shRNA. Disrupting ZFX significantly increased survival of animals bearing the GSC-derived xenografts. P<0.001. (D and E): TUNEL assay detecting apoptosis (in green) in GBM tumors derived from the GSCs expressing shZFX or NT shRNA. Nuclei were stained with DAPI (in blue). Quantification (E) shows that a significant increase of apoptotic cell death was found in the xenografts derived from the GSCs expressing shZFX (sh09 or sh10). ***, p<0.001. Scale bars represent 40 μm (D). Data are means ± SD.
Figure 5
Figure 5
Ectopic expression of ZFX augmented GSC tumorsphere formation and tumor progression. (A): Immunoblot analysis of ZFX and c-Myc protein levels in the GSCs transduced with Flag-ZFX or vector control. Ectopic expression of ZFX (Flag-ZFX) up-regulates c-Myc expression. (B): IF staining of ZFX (in green) and c-Myc (in red) in T387 GSCs transduced with Flag-ZFX or vector control. Nuclei were counterstained with DAPI (in blue). Forced expression of ZFX (Flag-ZFX) increased c-Myc levels. (C-E): Tumorsphere formation of GSCs expressing Flag-ZFX or vector control. Representative images of tumorspheres derived from the GSCs transduced with Flag-ZFX or vector control are shown (C). Quantifications indicate that ectopic expression of ZFX (Flag-ZFX) significantly increased the GSC tumorsphere number (D) and size (E). ***, p<0.004. (F): Cell growth curves of GSCs expressing Flag-ZFX or vector control. GSCs transduced with Flag-ZFX or vector control were measured for cell growth over a time course (day 0 to day 8). Forced expression of ZFX (Flag-ZFX) significantly enhanced the GSC growth. ***, p<0.001. (G and H): Bioluminescence imaging of GBM xenografts derived from GSCs transduced with Flag-ZFX or vector control. Sorted GSCs were transduced with firefly luciferase and Flag-ZFX or vector control through lentiviral infection, and then transplanted into brains of immunocompromised mice. Mice bearing the intracranial xenografts were monitored at indicated days after GSC transplantation. Representative images are shown (G). Luminescent quantification (H) indicated that ectopic expression of ZFX significantly augmented the GSC tumor growth in mouse brains. **, p<0.01. (I): Kaplan-Meier survival curves of mice intracranially implanted with GSCs expressing Flag-ZFX or vector control. Forced expression of ZFX (Flag-ZFX) in the GSCs significantly reduced survival of animals bearing the GSC-derived tumors. *, p<0.01. Scale bars represent 20 μm (B) 200 μm (C). Data are means ± SD.
Figure 6
Figure 6
ZFX controls c-Myc expression by binding to a specific sequence on the human c-Myc promoter. (A): RT-PCR analysis of ZFX, c-Myc, SOX2 and OLIG2 mRNA levels in GSCs expressing shZFX (sh09 or sh10) or NT shRNA. ZFX knockdown rapidly decreased expression of c-Myc but not SOX2 and OLIG2 in the GSCs. **, p<0.01; ns, p>0.05. (B): IF staining of ZFX (in green) and c-Myc (in red) in GSCs transduced with NT shRNA or shZFX (shZFX-09 or shZFX-10). Nuclei were stained with DAPI (in blue). ZFX disruption by shRNA attenuated c-Myc expression in T387 GSCs. (C): Immunoblot analysis of c-Myc and SOX2 expression after ectopic expression of ZFX (Flag-ZFX) in the GSCs. Forced expression of ZFX up-regulates c-Myc but not SOX2. (D): IF staining of Flag-ZFX (in green) and c-Myc (in red) in GSCs transduced with Flag-ZFX or vector control. Nuclei were counterstained with DAPI (in blue). Ectopic expression of Flag-ZFX increased c-Myc levels in the GSCs. (E): Analyses of c-Myc promoter activity using luciferase reporter assay in GSCs in response to ZFX ectopic expression. DNA fragments containing indicated regions of human c-Myc promoter were cloned into the luciferase reporter system. GSCs were transduced with the luciferase report system and Flag-ZFX or vector control. The relative luciferase activity were measured and quantified. The c-Myc promoter fragment lacking the P2 region lost the response to ZFX ectopic expression. **, p<0.001; *, p>0.05. (F and G): Luciferase reporter assay showing mutations in the conserved ZFX binding site (G) on P2 region of c-Myc promoter abolished the promoter activity in response to ZFX overexpression. WT: wild type; MT: mutated. **, p<0.001; ns, p>0.05. (H): Chromatin immunoprecipitation (ChIP) assay and PCR analysis of ZFX-binding fragments of c-Myc promoter in GSCs. CHIP assay was performed with an anti-ZFX specific antibody or IgG control. DNA fragments of the c-Myc promoter regions bound to ZFX were amplified by PCR and then confirmed by sequencing. Scale bars represent 20 μm (B and D). Data are means ± SD.
Figure 7
Figure 7
Ectopic expression of c-Myc to its endogenous level was able to rescue growth inhibition of GSC tumors caused by ZFX disruption. (A and B): In vivo bioluminescent imaging of GBM xenografts derived from luciferase-labeled GSCs transduced with Flag-c-Myc or vector control in combination with shZFX (sh09 or sh10) or NT shRNA. Luciferase-labeled GSCs were transduced with Flag-c-Myc or vector control and shZFX or NT shRNA through lentiviral infection, and then transplanted into brains of immunocompromised mice. Mice bearing the intracranial xenografts were monitored after the GSC transplantation. Representative images at indicated days post-transplantation are shown (A). Quantification of luminescence indicates that ectopic expression of c-Myc restored GSC tumorigenic potential impaired by ZFX disruption (B). *, p<0.001; **, p>0.05. (C): Kaplan-Meier survival curves of mice implanted with GSCs transduced with Flag-ZFX or vector control in combination with shZFX (sh09 or sh10) or NT shRNA. Mice implanted with the GSCs were maintained until the development of neurological signs. Ectopic expression of c-Myc in the GSCs significantly attenuated the increased survival of mice caused by ZFX disruption in the GSC-derived tumors. (D and E): TUNEL assay detecting apoptosis (in green) in GBM tumors derived from GSCs expressing Flag-ZFX or vector in combination with shZFX or NT shRNA. Quantification (E) of TUNEL intensity shows that ectopic expression of c-Myc abolished the increased apoptotic cell death caused by ZFX disruption in the GSC-derived xenografts. ***, p<0.001. Scale bars represent 40 μm (D). Data are means ± SD.

References

    1. Furnari FB, Fenton T, Bachoo RM, et al. Malignant astrocytic glioma: genetics, biology, and paths to treatment. Genes Dev. 2007;21:2683–2710. - PubMed
    1. Stupp R, Hegi ME, Mason WP, et al. Effects of radiotherapy with concomitant and adjuvant temozolomide versus radiotherapy alone on survival in glioblastoma in a randomised phase III study: 5-year analysis of the EORTC-NCIC trial. Lancet Oncol. 2009;10:459–466. - PubMed
    1. Wen PY, Kesari S. Malignant gliomas in adults. N Engl J Med. 2008;359:492–507. - PubMed
    1. Bonavia R, Inda MM, Cavenee WK, et al. Heterogeneity maintenance in glioblastoma: a social network. Cancer Res. 2011;71:4055–4060. - PMC - PubMed
    1. Magee JA, Piskounova E, Morrison SJ. Cancer stem cells: impact, heterogeneity, and uncertainty. Cancer Cell. 2012;21:283–296. - PMC - PubMed

Publication types

MeSH terms

Substances