. 2014 Jul;42(12):e101.
doi: 10.1093/nar/gku392. Epub 2014 May 15.

Performance comparison of SNP detection tools with illumina exome sequencing data--an assessment using both family pedigree information and sample-matched SNP array data

Affiliations

Performance comparison of SNP detection tools with illumina exome sequencing data--an assessment using both family pedigree information and sample-matched SNP array data

Ming Yi et al. Nucleic Acids Res. 2014 Jul.

Abstract

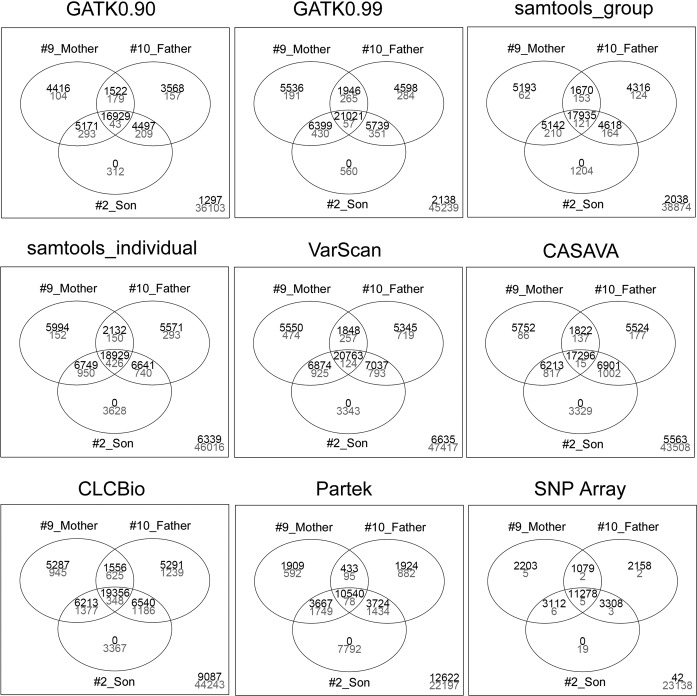
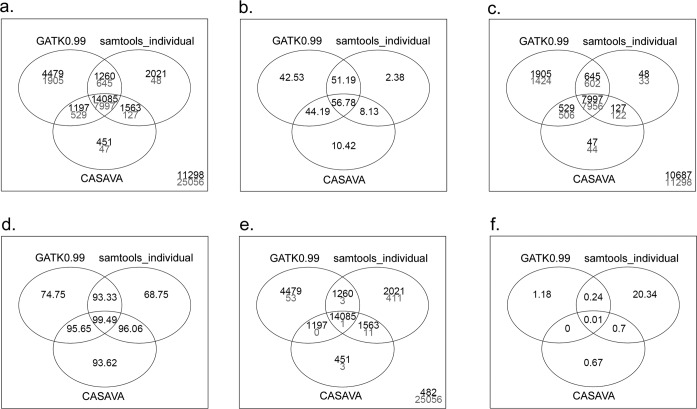
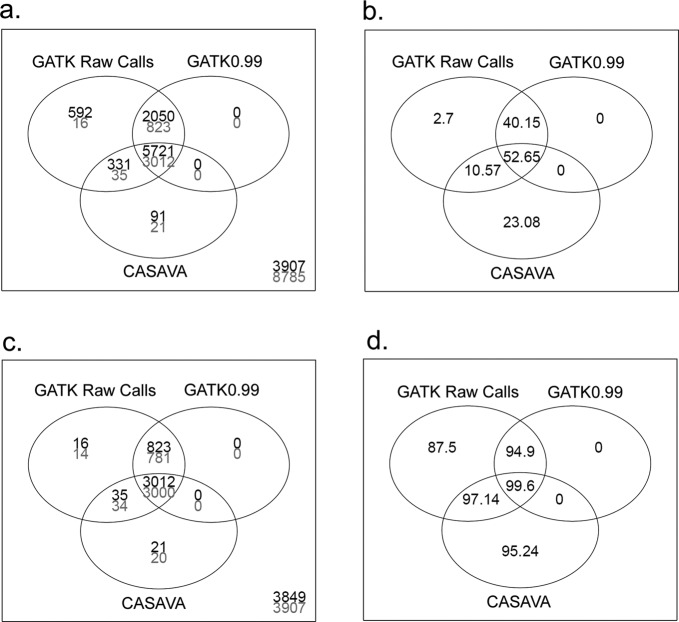
To apply exome-seq-derived variants in the clinical setting, there is an urgent need to identify the best variant caller(s) from a large collection of available options. We have used an Illumina exome-seq dataset as a benchmark, with two validation scenarios--family pedigree information and SNP array data for the same samples, permitting global high-throughput cross-validation, to evaluate the quality of SNP calls derived from several popular variant discovery tools from both the open-source and commercial communities using a set of designated quality metrics. To the best of our knowledge, this is the first large-scale performance comparison of exome-seq variant discovery tools using high-throughput validation with both Mendelian inheritance checking and SNP array data, which allows us to gain insights into the accuracy of SNP calling through such high-throughput validation in an unprecedented way, whereas the previously reported comparison studies have only assessed concordance of these tools without directly assessing the quality of the derived SNPs. More importantly, the main purpose of our study was to establish a reusable procedure that applies high-throughput validation to compare the quality of SNP discovery tools with a focus on exome-seq, which can be used to compare any forthcoming tool(s) of interest.


Figures

Figure 1.
Figure 1.
Distribution of SNP positions across family trio in selected SNP callers. SNPs of family trio composed of samples #9 (mother), #10 (father) and #2 (son) (Supplementary Figure S1), which were generated from GATK0.90 and GATK0.99 (VQSR at 0.90 and 0.99 threshold levels), samtools (call SNPs from samples either as a group or as individuals), VarScan, Partek, CLCBio, Illumina CASAVA and SNP array, were subjected to Venn diagram analysis for their positions. The numbers shown in the overlap indicate shared SNVs between the trio members and those in unique areas indicate unique SNVs for those members. Numbers in black are the number of SNV positions passing MIEC, whereas numbers in gray are the number of SNV positions failing MIEC. Similar results were obtained for the other two trio sets (with sample #3 or # 4 as child) available in the family (data not shown).
Figure 2.
Figure 2.
Distribution of SNP positions of the common SNPs of all members of family trio detected by GATK 0.99, samtools Individuals and Illumina CASAVA. Common SNPs of all members from family trio including #9, #10 and #2, which were generated from GATK 0.99 (0.99 threshold levels), samtools (call SNPs from samples as individuals) and Illumina CASAVA (Figure 1), were subjected to further Venn diagram analysis for their positions in details. The numbers shown in the overlapping areas indicate shared variants between the tools and those in unique areas indicate unique variants for each tool. (a) Numbers in black are the number of SNV positions passing MIEC, whereas numbers in gray are the number of variants designed for detection on the SNP array. (b) Numbers are percentage of SNVs passing MIEC that are also SNPs designed for detection on the SNP array (gray number divided by black number in each corresponding section of (a). (c) Numbers in black are the numbers of NGS-detected SNVs passing MIEC that are also designed for detection on the array, whereas numbers in gray are the number of SNPs designed for detection on SNP array for the same positions of NGS-detected SNVs passing MIEC, which has also passed MIEC within array data. (d) Percentage of NGS-detected SNVs passing MIEC that were also array-detected SNPs passing MIEC (gray number divided by black number in each corresponding section of (c). (e) Numbers in black indicate number of SNVs passing MIEC, whereas numbers in gray indicate the number of SNVs failing MIEC. (f) Error rate of MIEC based on (e) (gray number divided by black number in each corresponding section of (e).
Figure 3.
Figure 3.
Heads-up comparison of GATK and CASAVA on the subset of SNPs passing MIEC under one of the three best MIEC scenarios. The three best MIEC scenarios are as follows. (i) Both parents are homozygous variant and child has to be homozygous variant. (ii) Both parents are homozygous reference and child has to be homozygous reference. (iii) One of parents is homozygous variant and the other parent is homozygous reference and the child has to be heterozygous variant. SNVs derived from GATK raw calls (No VQSR Filtering), GATK0.99 or CASAVA that meets the MIEC scenario (i) were subjected to Venn diagram analysis. (a) Numbers in black indicate number of SNVs derived from NGS data that passed the above MIEC scenario. Numbers in gray indicate the number of SNVs derived from NGS data that passed the above MIEC scenario and also were designated SNVs for detection on SNP array. (b) Percentage of numbers in gray over the numbers in black in each area of (a). (c) numbers in black indicate numbers of SNVs derived from NGS data that passed the above MIEC scenario and also were designated SNPs for detection on SNP array. Numbers in gray are the numbers of SNPs designed for detection on SNP array for the same positions of NGS-detected SNVs passing MIEC, which has also passed MIEC within array data. (d) Percentage of numbers in gray over the numbers in black in each area of (c). A similar observation was made for other two scenarios (data not shown).

References

    1. Hamosh A., Scott A.F., Amberger J.S., Bocchini C.A, Mckusick VA. Online Mendelian Inheritance in Man (OMIM), a knowledgebase of human genes and genetic disorders. Nucleic Acids Res. 2005;33:D514–D517. - PMC - PubMed
    1. Hindorff L.A., Sethupathy P., Junkins H.A., Ramos E.M., Mehta J.P., Collins F.S., Manolio T.A. Potential etiologic and functional implications of genome-wide association loci for human diseases and traits. Proc. Natl. Acad. Sci. U.S.A. 2009;106:9362–9367. - PMC - PubMed
    1. The 1000 Genomes Project Consortium. A map of human genome variation from population-scale sequencing. Nature. 2010;467:1061–1073. - PMC - PubMed
    1. Shendure J., Ji H. Next-generation DNA sequencing. Nat. Biotechnol. 2008;26:1135–1145. - PubMed
    1. Metzker M.L. Sequencing technologies - the next generation. Nat. Rev. Genet. 2010;11:31–46. - PubMed

Publication types